Bokeh is an interactive visualization library for modern web browsers. It provides elegant, concise construction of versatile graphics, and affords high-performance interactivity over large or streaming datasets. Bokeh can help anyone who would like to quickly and easily make interactive plots, dashboards, and data applications.
To get started using Bokeh to make your visualizations, begin with the User Guide.
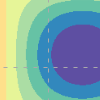
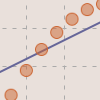
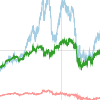
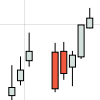
For examples of how you might use Bokeh with your own data, peruse the Gallery.
For detailed information about specific Bokeh components, consult the Reference.
If you are interested in contributing to Bokeh, or extending the library, check out the Developers Guide.
If you’d like to search for a particular topic, use the search box below:
|
|
|

|
|
|
|
|
|
|
|
|
|

|
|
|
|
|
|
|
|