Gallery
See the sections below for examples of using Bokeh in different ways.
Server App Examples
The examples linked below all show off usage of the Bokeh server. The Bokeh server provides a place where interesting things can happen—data can be updated to in turn update the plot, and UI and selection events can be processed to trigger more visual updates.

An interactive query tool for a set of IMDB data
Source code: movies

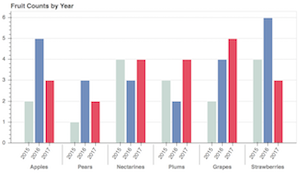
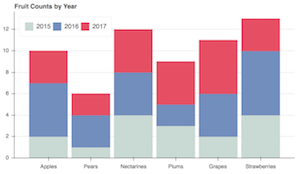
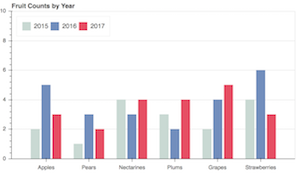
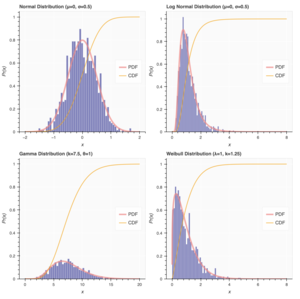
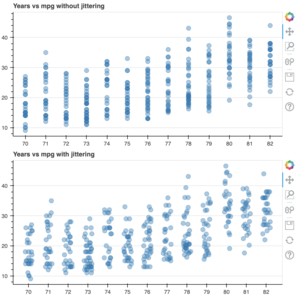
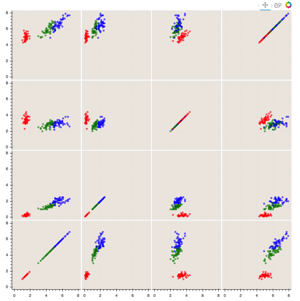
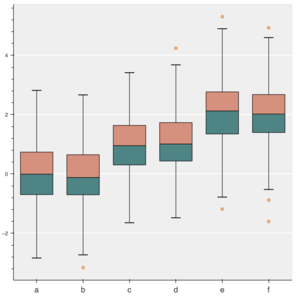
Shows axis histograms for selected and non-selected points in a scatter plot
Source code: selection_histogram

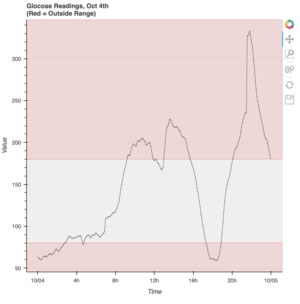
Interactive weather statistics for three cities
Source code: weather

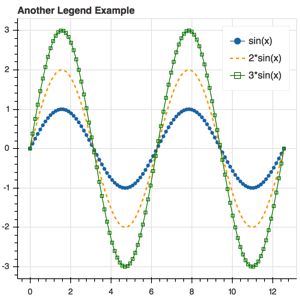
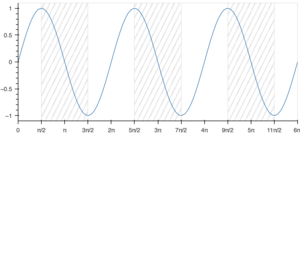
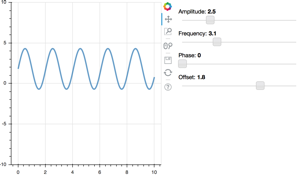
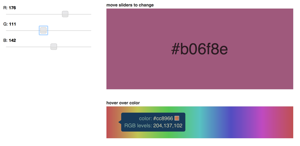
A basic demo that has sliders for controlling a plotted trigonometric function
Source code: sliders.py

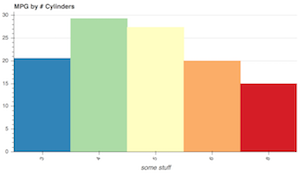
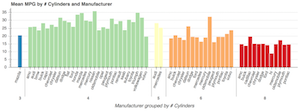
Explore the "autompg" data set by selecting and highlighting different dimensions
Source code: crossfilter

A reproduction of the famous Gapminder demo, with embedded video added using a custom page template
Source code: gapminder

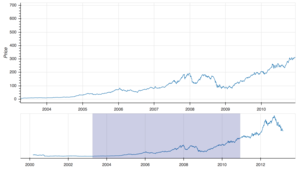
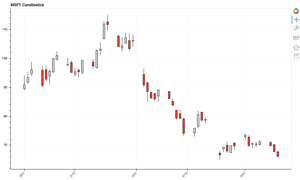
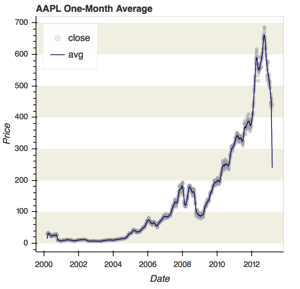
Linked plots, summary statistics, and correlations for market data
Source code: stocks

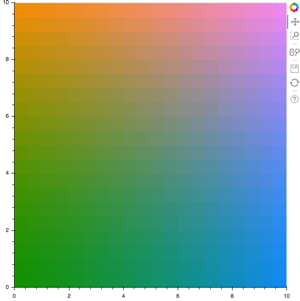
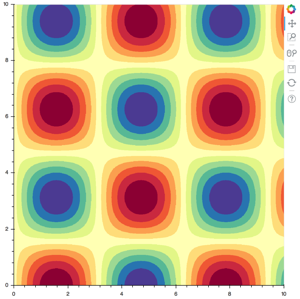
An updating 3d plot that demonstrates using Bokeh custom extensions to wrap third-party JavaScript libraries
Source code: surface3d

Explore the "autompg" data set by selecting and highlighting different dimensions
Source code: export_csv
Notebook Examples
The best place to immediately experiment with Bokeh in notebooks is in the live tutorial notebooks hosted online by MyBinder.
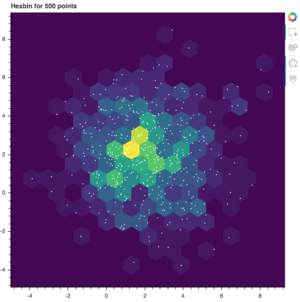
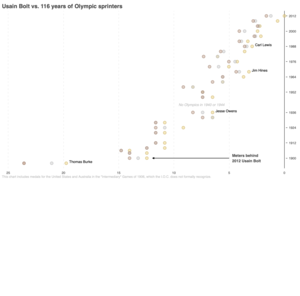
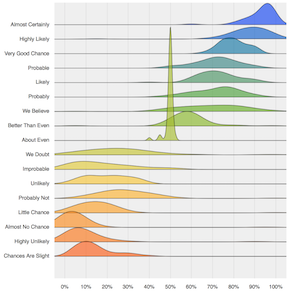
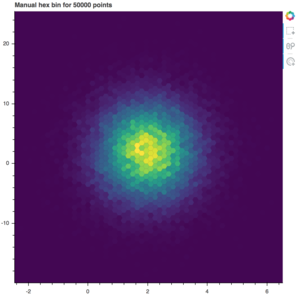
Standalone Examples
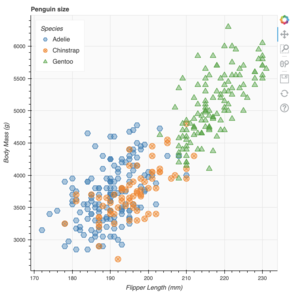
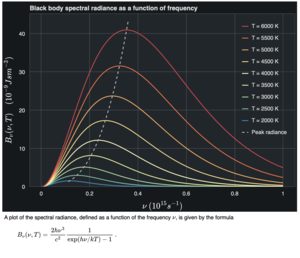
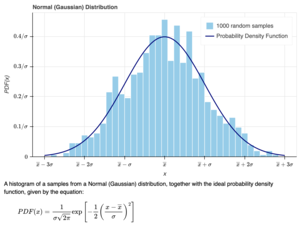
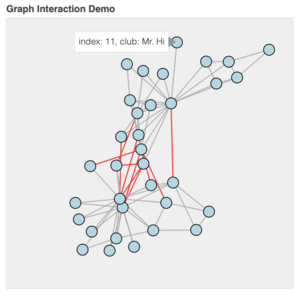
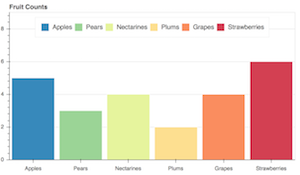
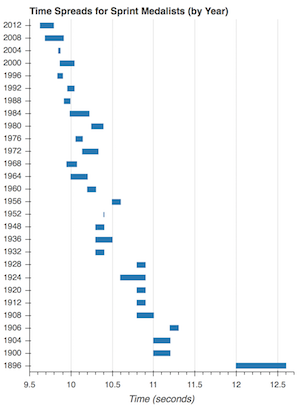
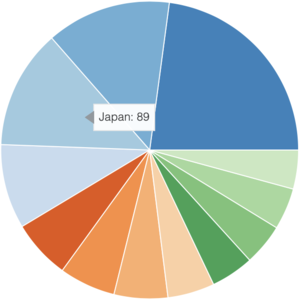
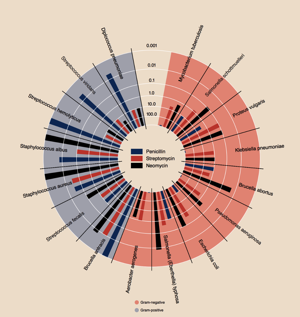
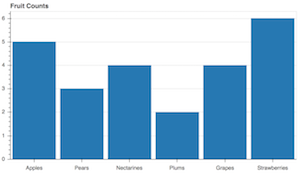
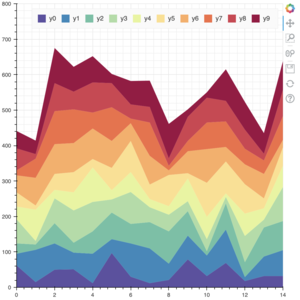
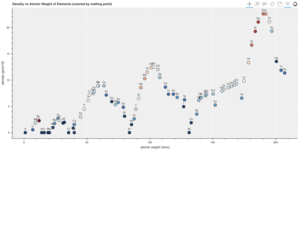
All of the examples below are located in the examples subdirectory of your Bokeh checkout. By “standalone” we mean that these examples make no use of the Bokeh server. These plots still have many interactive tools and features, including linked panning and brushing, and hover inspectors.
Click on an image below to see its code and interact with the live plot.