First steps 7: Displaying and exporting#
In the previous first steps guides, you created, customized, and combined visualizations.
In this section, you will use various methods to display and export your visualizations.
Creating a standalone HTML file#
All examples so far have used the show() function to save your visualization to
an HTML file. This HTML file contains all the necessary information to display
your plot.
To customize the file Bokeh creates for your visualization, import and call the
output_file() function. output_file() accepts various file-related
arguments. For example:
filename: the filename for the HTML file. If you don’t supply a file name, Bokeh will use the file name of your python file as a filename for the HTML file it creates.title: the title for you document (to be used in the HTML’s<title>tag)
Bokeh creates the HTML file when you call the show() function. This function
also automatically opens a web browser to display the HTML file.
If you want Bokeh to only generate the file but not open it in a web browser,
use the save() function instead.
You need to import the save() and output_file() functions before using,
just like you did for show().
from bokeh.plotting import figure, output_file, save

# prepare some data
x = [1, 2, 3, 4, 5]
y = [4, 5, 5, 7, 2]

# set output to static HTML file
output_file(filename="custom_filename.html", title="Static HTML file")

# create a new plot with a specific size
p = figure(sizing_mode="stretch_width", max_width=500, height=250)

# add a circle renderer
circle = p.circle(x, y, fill_color="red", size=15)

# save the results to a file
save(p)
See also
For more information on embedding Bokeh visualizations online, see Embedding Bokeh content in the user guide.
Note
By default, Bokeh-generated HTML files include a standard version of BokehJS
that is automatically downloaded from Bokeh’s servers. Use the argument
mode with the function output_file() to change this behavior. For
more information, see output_file() and Resources
in the reference guide.
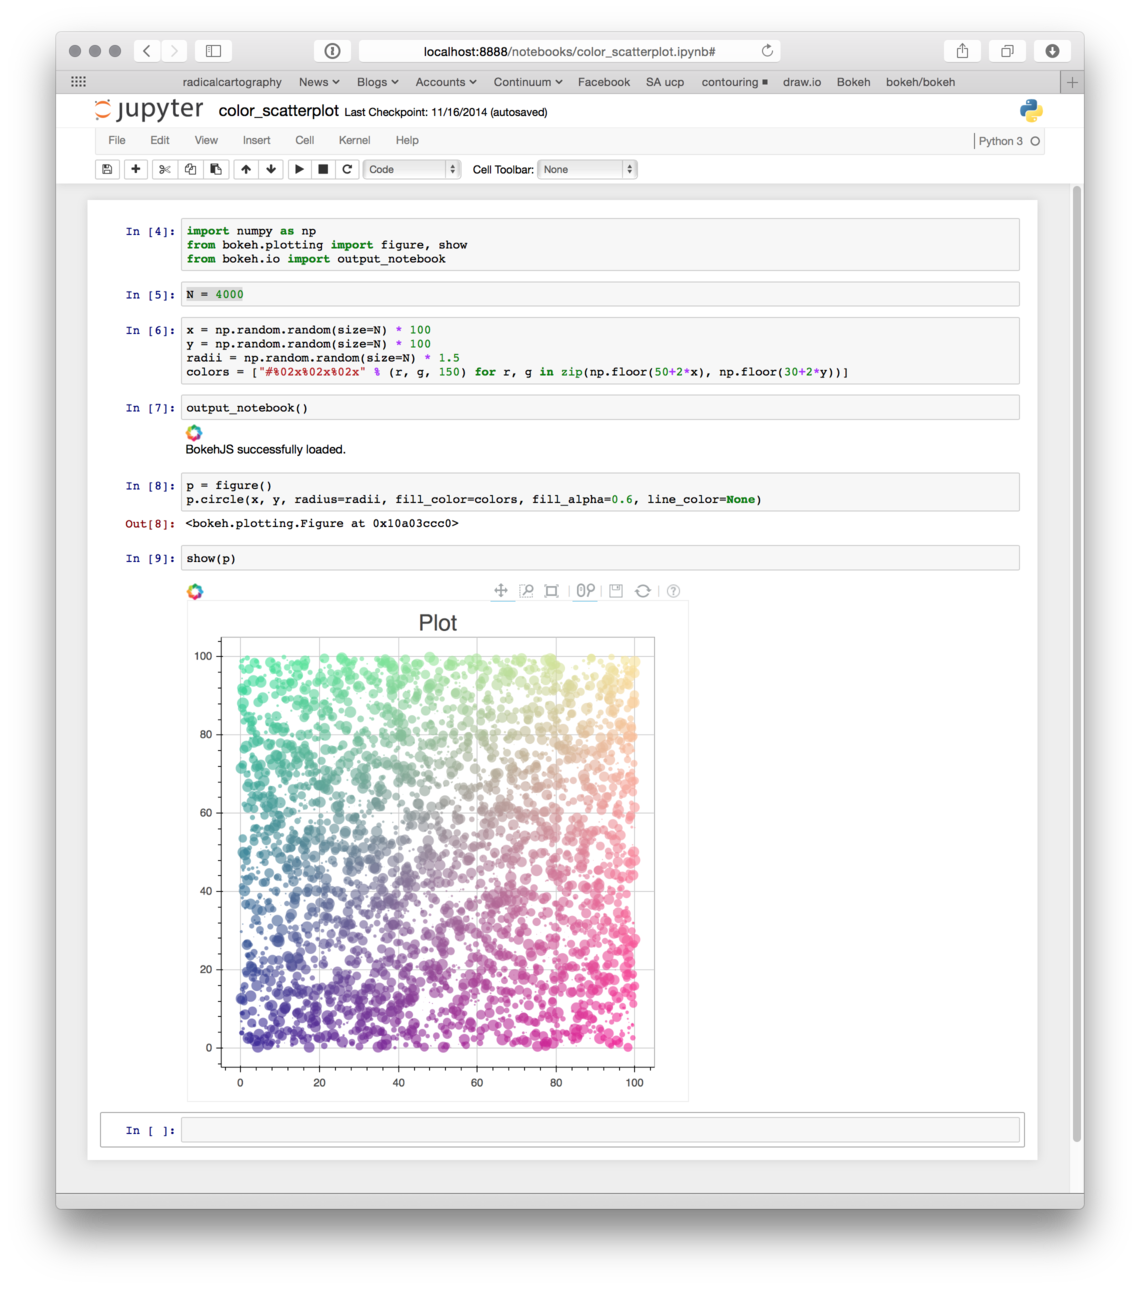
Displaying in a Jupyter notebook#
If you use Jupyter notebooks, call Bokeh’s output_notebook() function in your
code. Then, use the show() function to display your visualization right inside
your notebook:
See also
For more information on using Jupyter notebooks, see Using with Jupyter in the user guide.
Interact directly with live tutorial notebooks hosted online by MyBinder.
Exporting PNG files#
To export PNG or SVG files, you might need to install additional dependencies.
In order to create PNG and SVG files, Bokeh uses Selenium. Selenium allows Bokeh to run in a browser without a graphical user interface. Bokeh uses this browser to render the PNG or SVG files. In order for this to work, Selenium needs to be able to access either a Firefox browser (through the geckodriver package) or a Chrome/Chromium browser (through the chromedriver package).
Use this command to install Selenium with geckodriver and Firefox in a conda environment:
conda install selenium geckodriver firefox -c conda-forge
See Additional dependencies for more options to install the required packages.
Once the requirements are installed, you can use the
export_png() function to export your plot into a PNG file:
from bokeh.io import export_png
from bokeh.plotting import figure

# prepare some data
x = [1, 2, 3, 4, 5]
y = [4, 5, 5, 7, 2]

# create a new plot with fixed dimensions
p = figure(width=350, height=250)

# add a circle renderer
circle = p.circle(x, y, fill_color="red", size=15)

# save the results to a file
export_png(p, filename="plot.png")
See also
For information on how to export PNG and SVG files, see Exporting plots in the user guide.