Using with Jupyter#
Working in notebooks#
Jupyter notebooks are computable documents often used for exploratory work, data analysis, teaching, and demonstration. A notebook is a series of input cells that can execute individually to immediately display their output. In addition to Classic notebooks, there are also notebooks for the newer JupyterLab project. Bokeh can embed both standalone and Bokeh server content with either.
Standalone output#
Standalone Bokeh content doesn’t require a Bokeh server and can be embedded directly in classic Jupyter notebooks as well as in JupyterLab.
Classic notebooks#
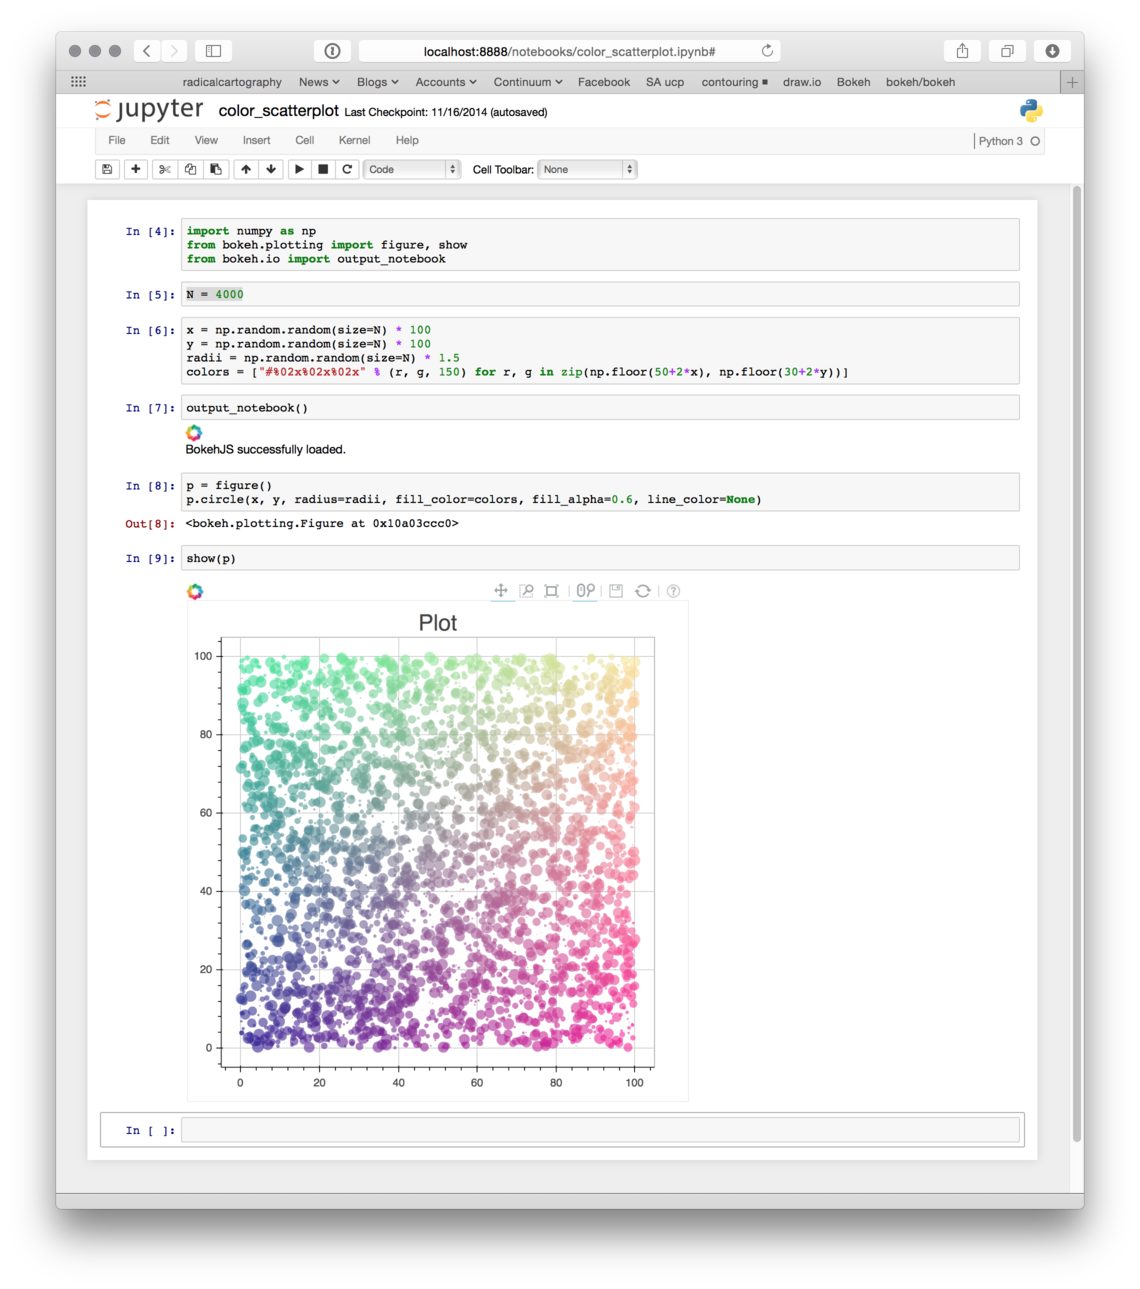
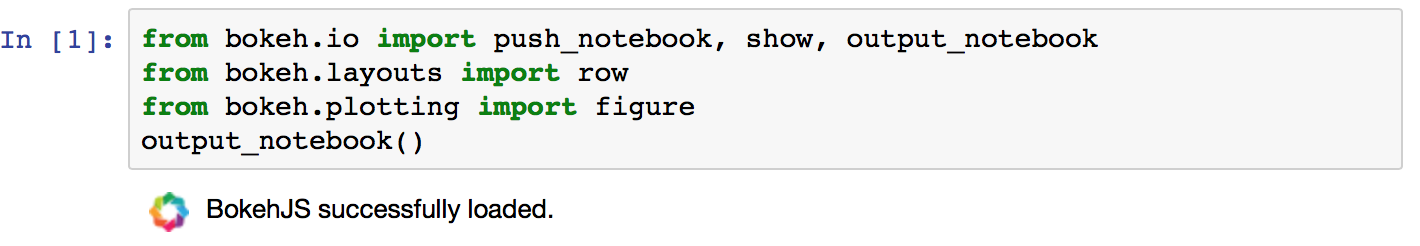
To display Bokeh plots inline in a classic Jupyter notebook, use the
output_notebook() function from bokeh.io instead of (or in addition to)
the output_file() function. No other modifications are required. When you
call show(), the plot will display inline in the next notebook output cell.
See a screenshot of Jupyter below:
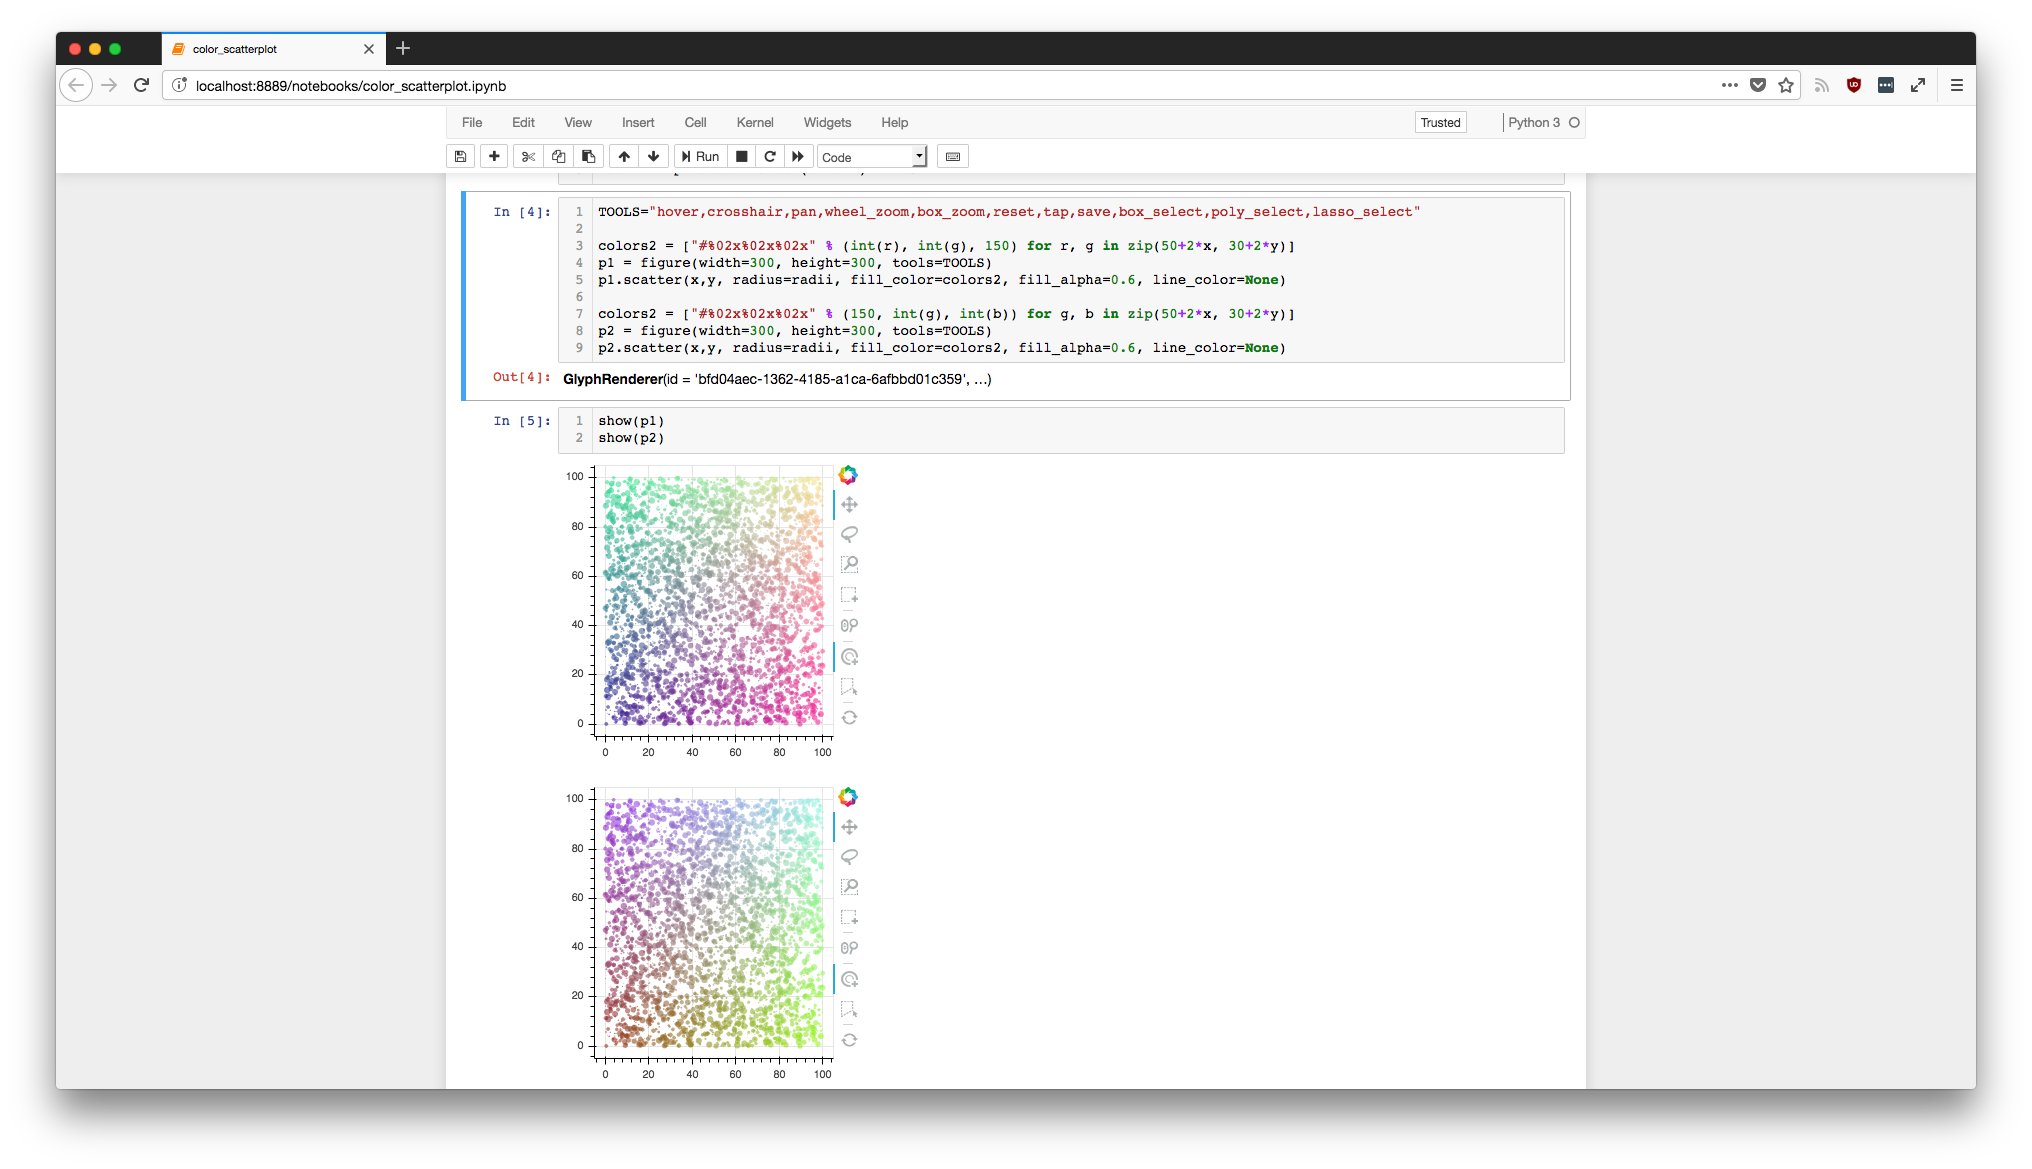
To have a single notebook output cell display multiple plots, call show()
multiple times in the input cell. The plots will display in order.
JupyterLab#
To use JupyterLab with Bokeh, you should at least use version 3.0 of JupyterLab. Enabling Bokeh visualizations in JupyterLab also requires the jupyter_bokeh extension to be installed.
After installing JupyterLab, you can use either pip or conda to install
jupyter_bokeh:
For instructions on installing jupyter_bokeh with versions of JupyterLab older than 3.0, see the README in the GitHub repository of jupyter_bokeh.
Once you have jupyter_bokeh installed, you can use Bokeh just like you would with a classic notebook.
Bokeh server applications#
You can also embed full Bokeh server applications connecting plot events and Bokeh’s built-in widgets directly to Python callback code. See Running a Bokeh server for general information about Bokeh server applications. For a complete example of a Bokeh application embedded in a Jupyter notebook, refer to the following notebook:
JupyterHub#
When running notebooks from your own JupyterHub instance, some additional steps are necessary to embed Bokeh server applications and to enable network connectivity between the client browser and the Bokeh server running in a JupyterLab cell. This is because your browser needs to connect to the port the Bokeh server is listening on. However, JupyterHub is acting as a reverse proxy between your browser and your JupyterLab container. Follow all the JupyterLab instructions above, then continue with the following steps:
Install the
jupyter-server-proxypackage and enable the server extension as follows:pip install jupyter-server-proxy && jupyter serverextension enable --py jupyter-server-proxy
If you intend to work with JupyterLab you need to install the corresponding extension, either from the GUI or with the following command:
jupyter labextension install @jupyterlab/server-proxy
Define a function to help create the URL for the browser to connect to the Bokeh server.
See below for a reference implementation. You’ll have to either modify this code or assign the URL of your JupyterHub installation to the environment variable
EXTERNAL_URL. JupyterHub defaults toJUPYTERHUB_SERVICE_PREFIXin this case.def remote_jupyter_proxy_url(port): """ Callable to configure Bokeh's show method when a proxy must be configured. If port is None we're asking about the URL for the origin header. """ base_url = os.environ['EXTERNAL_URL'] host = urllib.parse.urlparse(base_url).netloc # If port is None we're asking for the URL origin # so return the public hostname. if port is None: return host service_url_path = os.environ['JUPYTERHUB_SERVICE_PREFIX'] proxy_url_path = 'proxy/%d' % port user_url = urllib.parse.urljoin(base_url, service_url_path) full_url = urllib.parse.urljoin(user_url, proxy_url_path) return full_url
Pass the function you defined in step 2 to the
show()function as thenotebook_urlkeyword argument. Bokeh then calls this function when it sets up the server and creates the URL to load a graph:show(obj, notebook_url=remote_jupyter_proxy_url)
You may need to restart your server after this, and then Bokeh content should load and execute Python callbacks defined in your Jupyter environment.
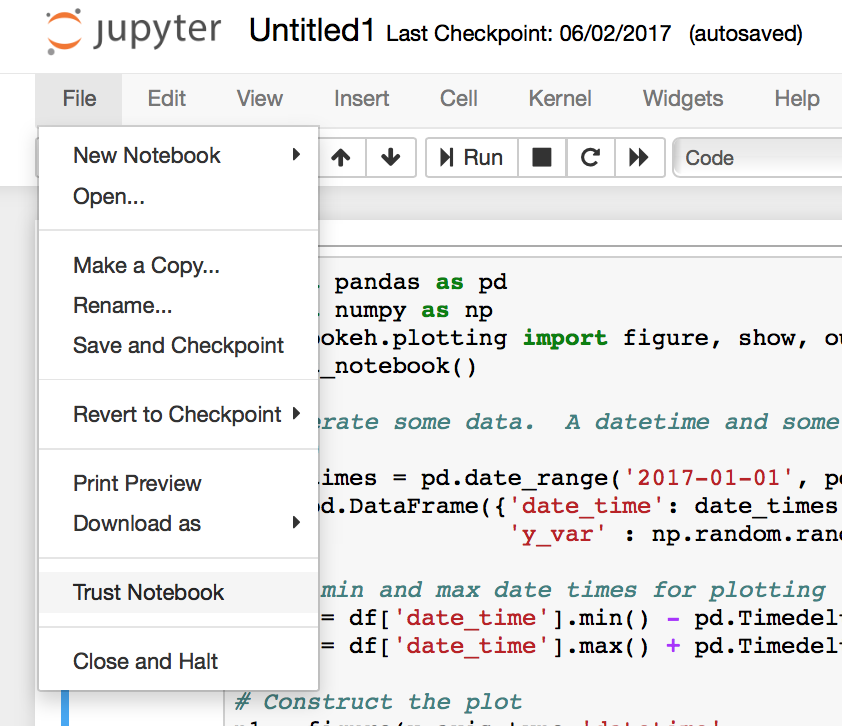
Trusting notebooks#
Depending on the version of the notebook you are using, you may have to trust the notebook for Bokeh plots to re-render when the notebook is closed and re- opened. The Trust Notebook option is typically located under the File menu:
Notebook slides#
You can use a notebook with Reveal.js to generate slideshows from cells.
You can also include standalone (i.e. non-server) Bokeh plots in such sideshows.
However, you will need to take a few extra steps to display the output correctly.
Particularly, make sure that the cell containing the output_notebook
is not be skipped.
Rendered cell output of the output_notebook call ensures that the
BokehJS library loads. Otherwise, Bokeh plots will not work. If this cell’s
type is set to “skip”, BokehJS will not load, and Bokeh plots will not display.
If you want to hide this cell, assign it the “notes” slide type.
Notebook handles#
You can update a displayed plot without reloading it. To do so, pass the
notebook_handle=True argument to show() for it to return a handle object.
You can use this handle object with the push_notebook() function to update the plot
with any recent changes to plots properties, data source values, etc.
This notebook handle functionality is only supported in classic Jupyter notebooks and is not implemented in JupyterLab or Zeppelin yet.
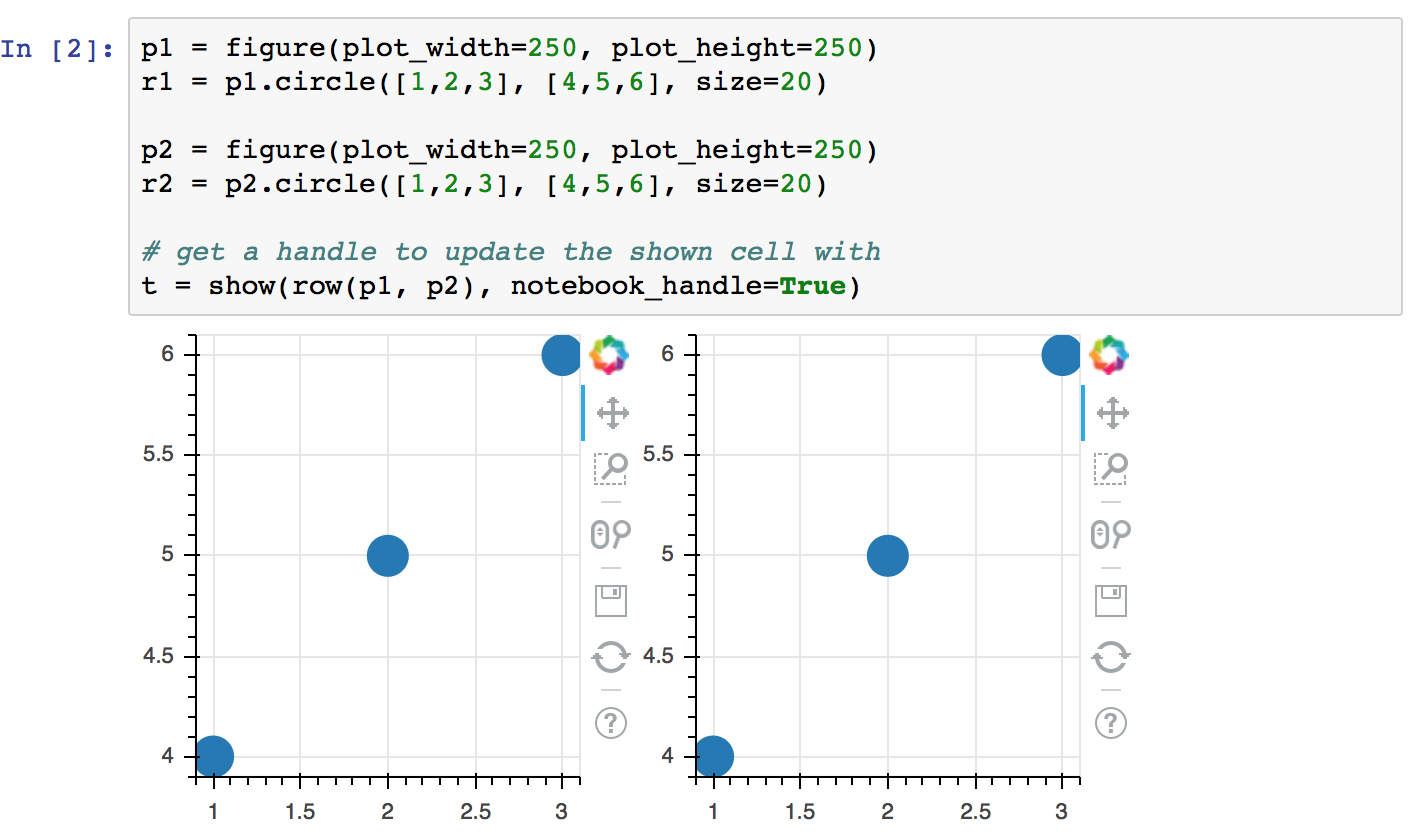
The following screenshots illustrate basic usage of notebook handles:
Import standard functions and
push_notebook():
Create some plots and pass
notebook_handle=Truetoshow():
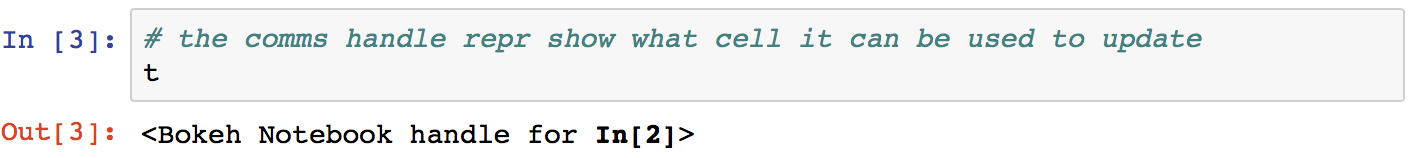
Check that the handle is associated with the output cell for
In[2]just displayed:
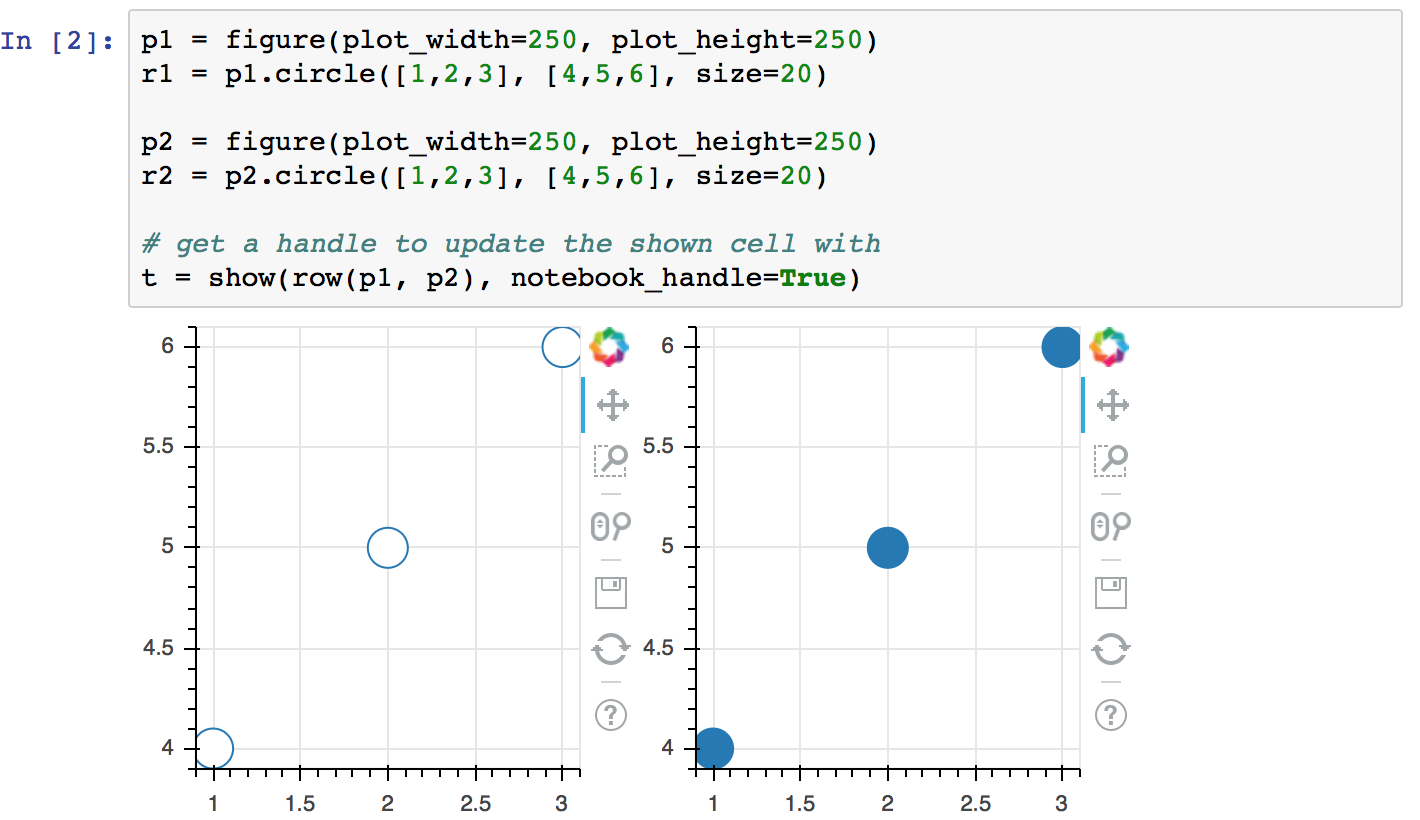
Update some properties of the plot, then call
push_notebook()with the handle:

Note that the output cell for
In[2]has changed (without being re-executed):
See the following notebooks for more detailed examples of notebook handle use:
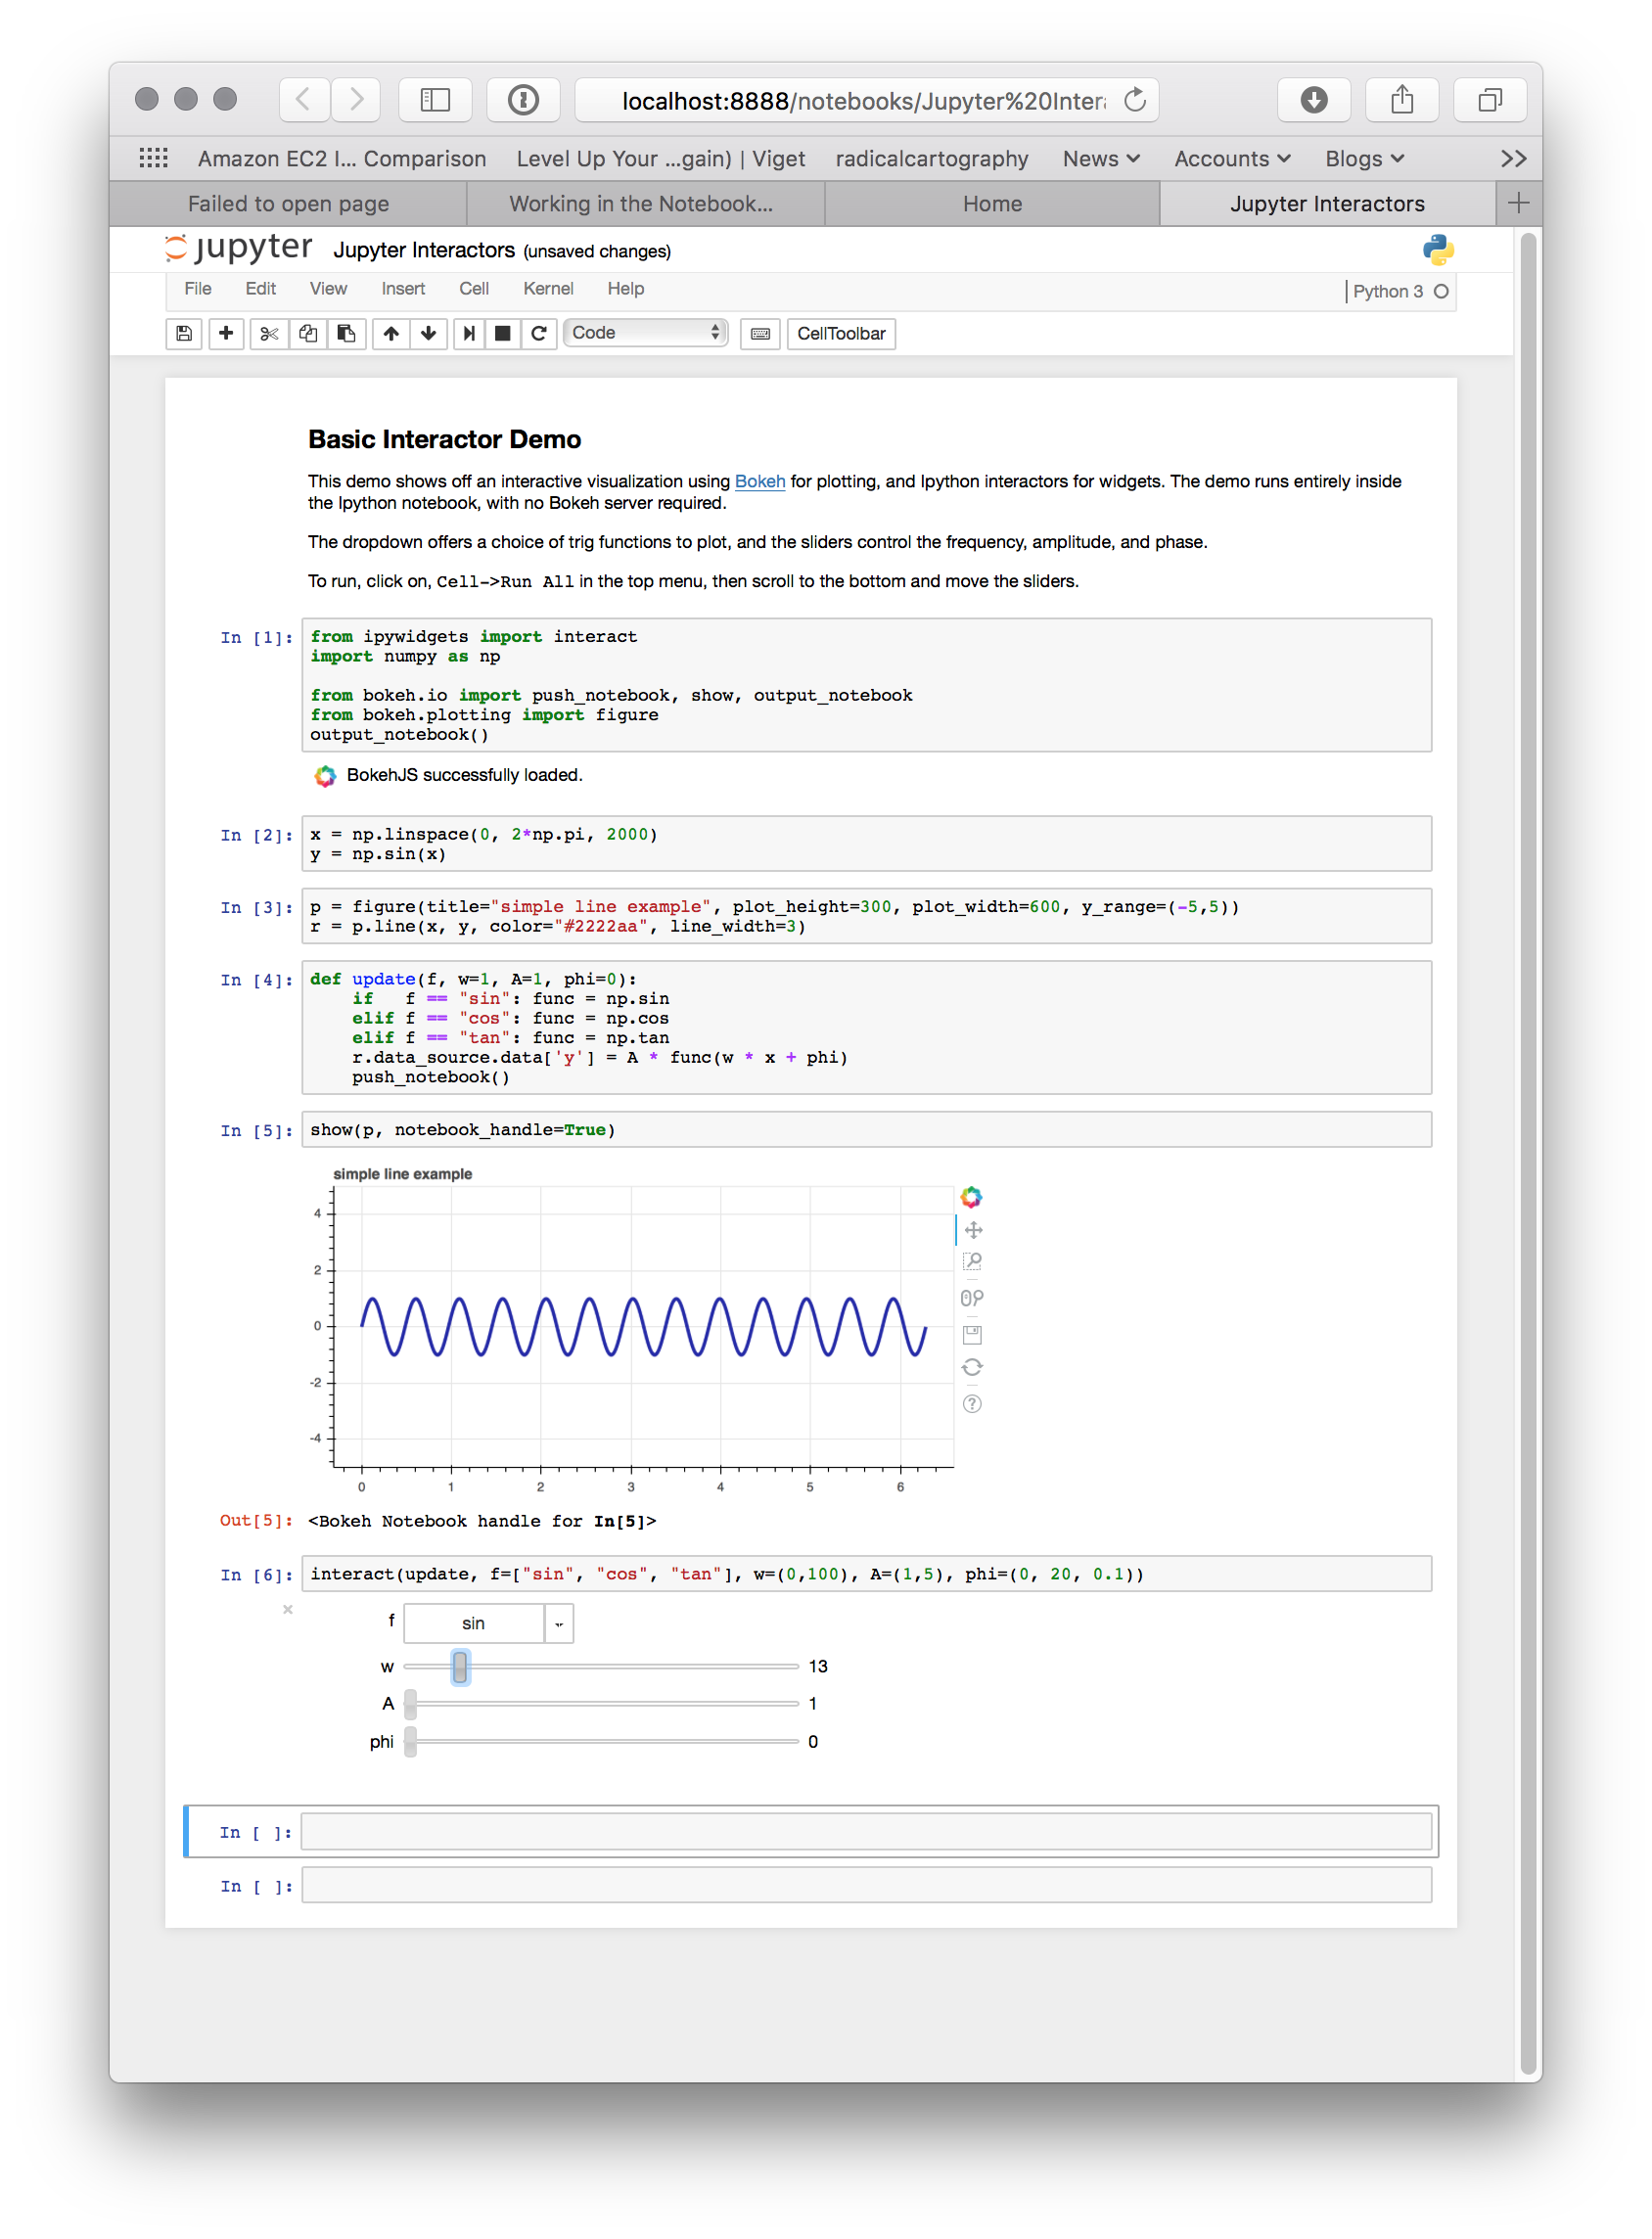
Jupyter interactors#
You can use notebook widgets, known as interactors, to update
Bokeh plots. The key to doing this is the push_notebook() function.
The update callback for the interactors calls this function
to update the plot from widget values. See a screenshot of the
examples/howto/notebook_comms/Jupyter Interactors.ipynb example
notebook below:
More example notebooks#
You can find many more examples of notebook use in the bokeh-notebook repository:
Clone the repository locally:
git clone https://github.com/bokeh/bokeh-notebooks.git
Launch the Jupyter notebooks in your web browser.
Alternatively, Binder hosts live notebooks that you can run online.
The main Bokeh repository also includes some notebooks under examples:
Notebook comms examples:
IPyWidgets outside the notebook#
Now that you know how to use Bokeh in the JupyterLab and classical notebook environments, you might want to take advantage of the vibrant Jupyter ecosystem outside of these environments. You can do so with the ipywidgets_bokeh extension for Bokeh:
$ conda install -c bokeh ipywidgets_bokeh
or
$ pip install ipywidgets_bokeh
This extension lets you use IPyWidgets in Bokeh. Simply wrap a widget in an
IPyWidget model and add the wrapper to a document or include it in a layout.
You don’t have to install or enable any other extensions.
Example#
Follow these steps to build an application with a single Jupyter slider that logs its adjustments to the console:
Start by constructing a widget and configuring an observer:
from ipywidgets import FloatSlider
angle = FloatSlider(min=0, max=360, value=0, step=1, description="Angle")

def on_change(change):
    print(f"angle={change['new']} deg")
angle.observe(on_change, names="value")
To integrate the widget with Bokeh, wrap it in
IPyWidget:from ipywidgets_bokeh import IPyWidget ipywidget = IPyWidget(widget=angle)
Add the wrapper to a Bokeh document:
from bokeh.plotting import curdoc
doc = curdoc()
doc.add_root(ipywidget)
To run the app, enter bokeh serve ipy_slider.py, where ipy_slider.py
is the name of the application (see Running a Bokeh server for details).
This application is available at http://localhost:5006/ipy_slider.
You can build on the above to create more complex layouts and include advanced widgets,
such as ipyleaflet and ipyvolume. For more examples, see examples/howto/ipywidgets
in the Bokeh repository.