Bokeh Logo Bokeh Menu
  • About
  • Gallery
  • Docs
  • Github
  • 0.11.1
    • 0.10.0
    • 0.9.3
    • 0.8.2
  • Installation
  • User Guide
  • Gallery
  • Reference
  • Releases
  • Developer Guide
  • Installation
  • User Guide
  • Quickstart
  • Getting Set Up
  • Defining Key Concepts
  • Plotting with Basic Glyphs
  • Making High-level Charts
  • Leveraging Other Libraries
  • Styling Visual Attributes
  • Configuring Plot Tools
  • Laying Out Multiple Plots
  • Working in the Notebook
  • Adding Interactions
  • Using bokeh Commands
  • Running a Bokeh Server
  • Embedding Plots and Apps
  • Speeding up with WebGL
  • Mapping Geo Data
  • Learning More
  • Tutorials
  • Reference Guide
  • bokeh
  • bokeh.charts
  • bokeh.client
  • bokeh.core
  • bokeh.document
  • bokeh.driving
  • bokeh.embed
  • bokeh.icons
  • bokeh.io
  • bokeh.model
  • bokeh.models
  • bokeh.mpl
  • bokeh.palettes
  • bokeh.plotting
  • bokeh.resources
  • bokeh.sampledata
  • bokeh.server
  • bokeh.settings
  • bokeh.sphinxext
  • bokeh.themes
  • bokeh.tile_providers
  • bokeh.util
  • BokehJS Reference
  • 0.11.1 (Feb 2016)
  • 0.11.0 (Jan 2016)
  • 0.10.0 (Sep 2015)
  • 0.9.3 (Aug 2015)
  • 0.9.2 (Jul 2015)
  • 0.9.1 (Jul 2015)
  • 0.9.0 (May 2015)
  • 0.8.2 (Mar 2015)
  • 0.8.1 (Feb 2015)
  • 0.8.0 (Feb 2015)
  • 0.7.1 (Jan 2015)
  • 0.7.0 (Dec 2014)
  • 0.6.1 (Sep 2014)
  • 0.6.0 (Sep 2014)
  • 0.5.2 (Aug 2014)
  • 0.5.1 (Jul 2014)
  • 0.5.0 (Jul 2014)
  • 0.4.4 (Apr 2014)
  • 0.4.2 (Mar 2014)
  • 0.4.1 (Feb 2014)
  • 0.4.0 (Feb 2014)
  • 0.3.0 (Nov 2013)
  • 0.2.0 (Oct 2013)
  • 0.1.0 (Apr 2013)
  • Developer Guide
  • Getting Set Up
  • Documentation
  • Testing
  • Bokeh Objects
  • Bokeh Server Architecture
  • Language Bindings
  • Notes
  • BokehJS

Gallery

Server App Examples

The examples linked below all show off usage of the Bokeh server. The Bokeh server provides a place where interesting things can happen—data can be updated to in turn update the plot, and UI and selection events can be processed to trigger more visual updates.

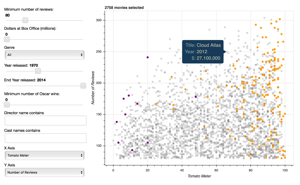
An interactive query tool for a set of IMDB data

Source code: movies

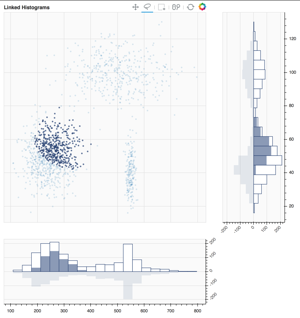
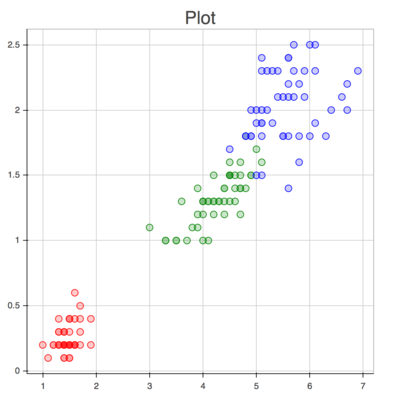
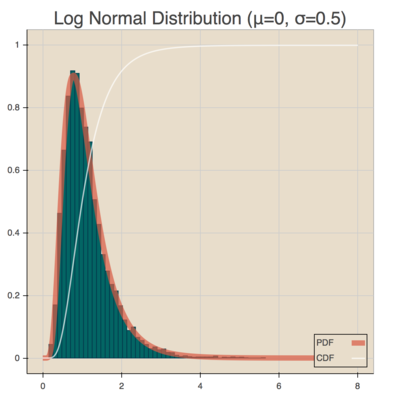
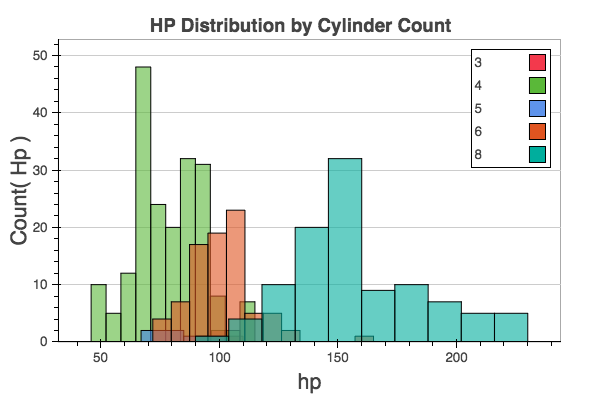
Shows axis histograms for selected and nonselected points in a scatter plot

Source code: selection_histogram

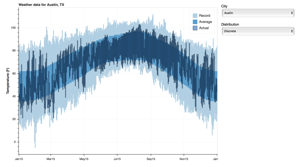
Interactive weather statistics for three cities.

Source code: weather

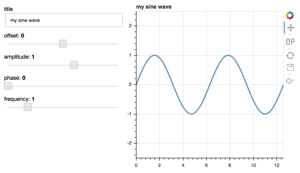
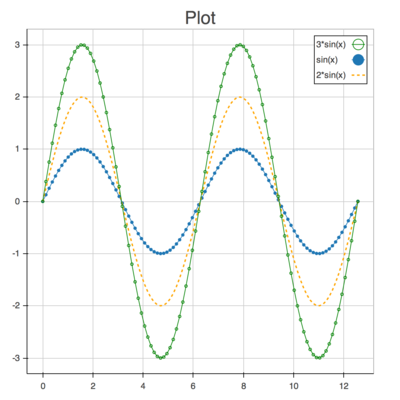
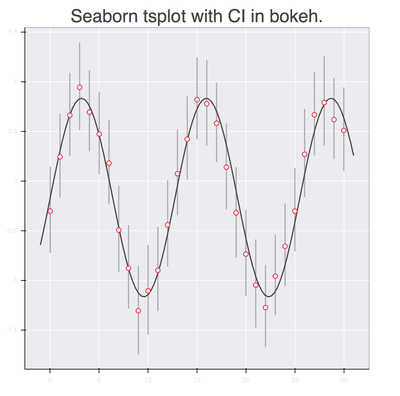
A basic demo that has sliders for controlling a plotted trigonometric function

Source code: sliders.py

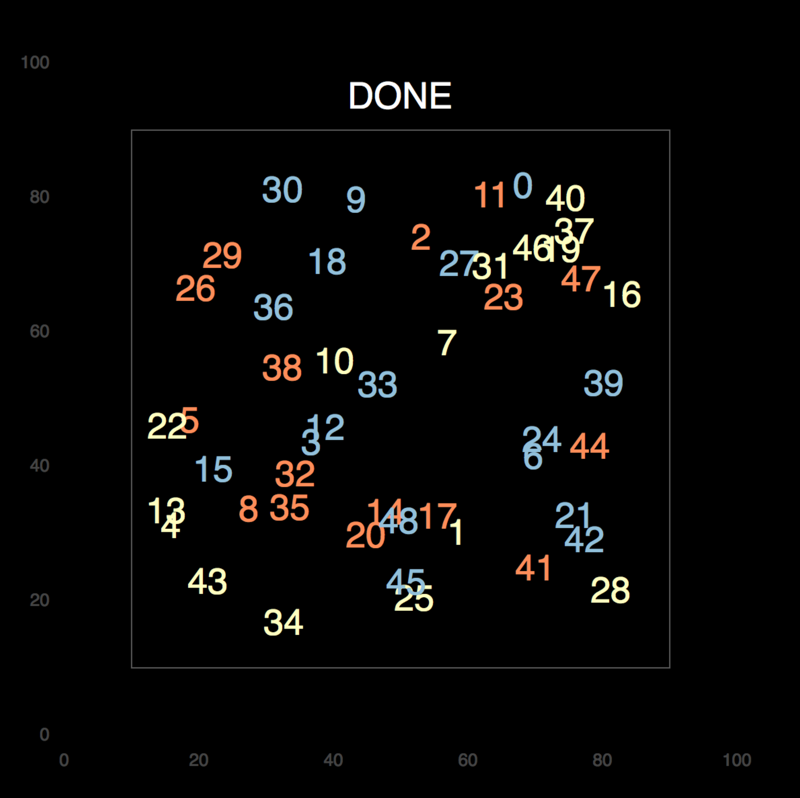
An updating plot that demonstrates using timeout callbacks in Bokeh server apps

Source code: timeout.py

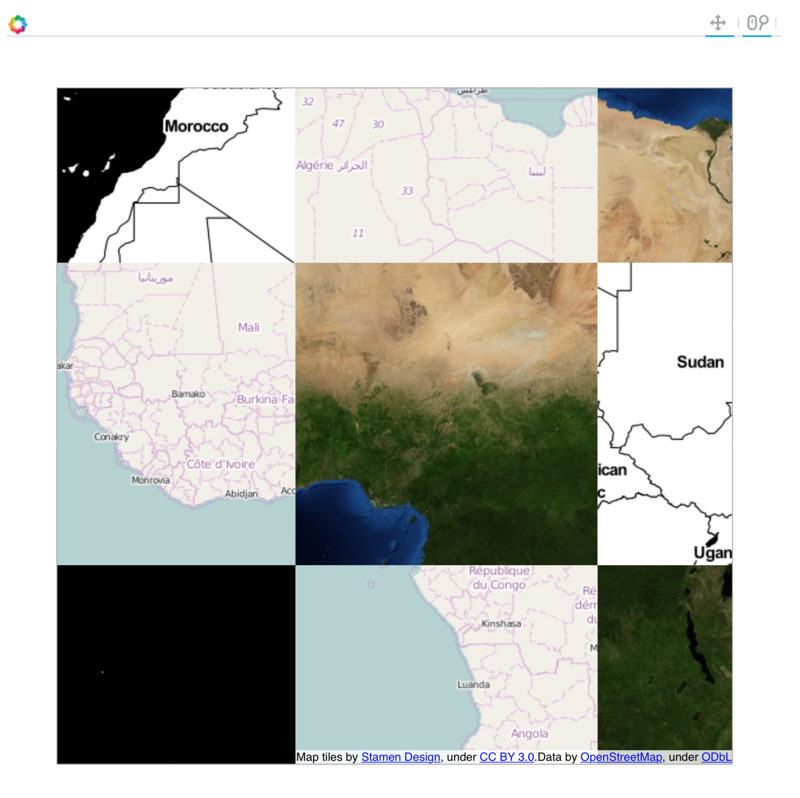
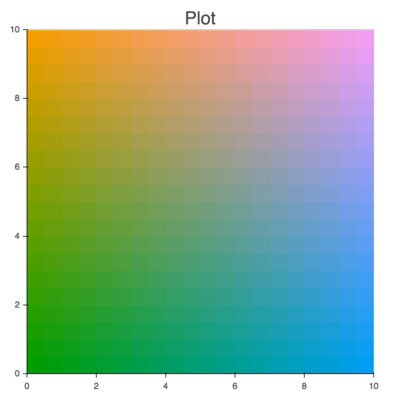
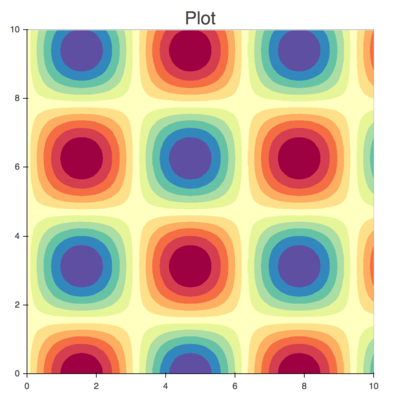
A user-defined extension showing randomized tiles.

Source code: random_tiles

Notebook Examples

A large number of static examples may be viewed directly online (or downloaded and executed locally) at the Bokeh NBViewer Gallery.

Standalone Examples

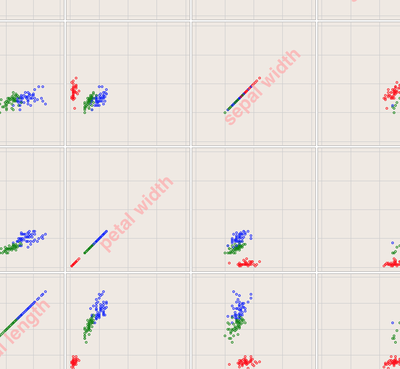
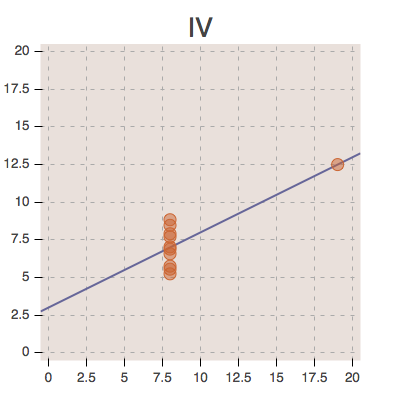
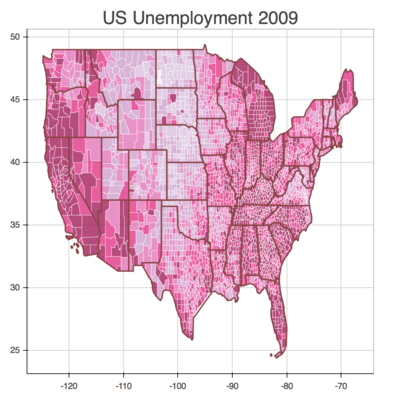
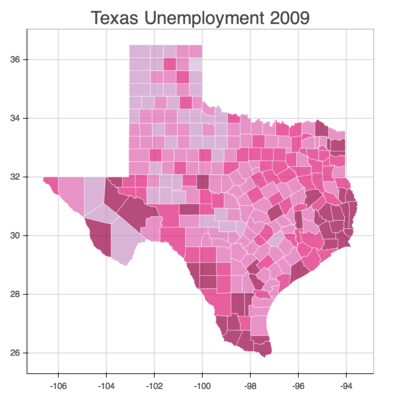
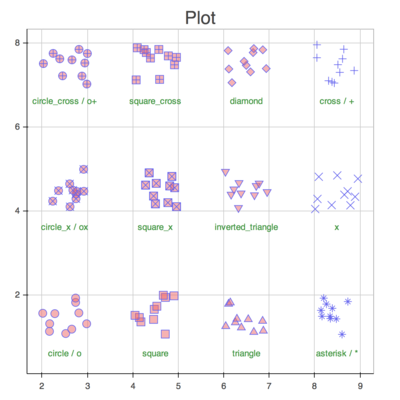
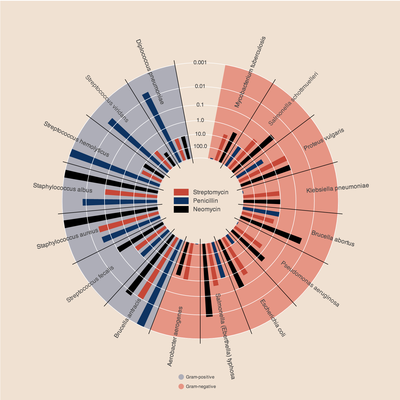
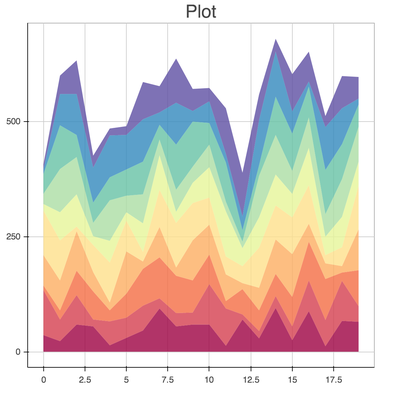
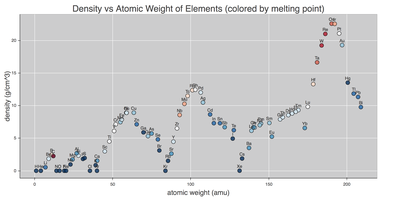
All of the examples below are located in the examples subdirectory of your Bokeh checkout. By “standalone” we mean that these examples make no use of the Bokeh server. These plots still have many interactive tools and features, including linked panning and brushing, and hover inspectors.

Click on an image below to see its code and interact with the live plot.

  • iris
  • image_rgba
  • candlestick
  • legend
  • box_annotation
  • les_mis
  • unemployment
  • stocks
  • streamline
  • quiver
  • categorical
  • periodic
  • histogram
  • image
  • lorenz
  • color_scatter
  • iris_splom
  • anscombe
  • choropleth
  • texas
  • scatter
  • burtin
  • brewer
  • elements
  • boxplot
  • area_chart
  • boxplot_chart
  • heatmap_chart
  • donut_chart
  • dot_chart
  • histograms_chart
  • iris_scatter_chart
  • line_chart
  • palettes
  • stacked_bar_chart
  • step_chart
  • density
  • ggplot_line
  • step
  • violin
  • sinerror
  • About Us
  • About
  • Team
  • Contact
  • Links
  • FAQs
  • Technical vision
  • Roadmap
  • Citation
  • Join Us
  • Contribute
  • Mailing list
  • Github
  • Twitter
  • YouTube
  • © Copyright 2015, Anaconda.