Grids and layouts#
Bokeh includes several layout options for plots and widgets. These let you arrange multiple components to create interactive dashboards and data applications.
Layout functions let you build a grid of plots and widgets. You can have as many rows, columns, or grids of plots in one layout as you like. Bokeh layouts also allow for a number of sizing options, or modes. These modes allow plots and widgets to resize to fit the browser window.
Built-in layouts#
Column layout#
To display plots or widgets vertically, use the column() function.
from bokeh.layouts import column
from bokeh.plotting import figure, show

x = list(range(11))
y0 = x
y1 = [10 - i for i in x]
y2 = [abs(i - 5) for i in x]

# create three plots
s1 = figure(width=250, height=250, background_fill_color="#fafafa")
s1.circle(x, y0, size=12, color="#53777a", alpha=0.8)

s2 = figure(width=250, height=250, background_fill_color="#fafafa")
s2.triangle(x, y1, size=12, color="#c02942", alpha=0.8)

s3 = figure(width=250, height=250, background_fill_color="#fafafa")
s3.square(x, y2, size=12, color="#d95b43", alpha=0.8)

# put the results in a column and show
show(column(s1, s2, s3))
Row layout#
To display plots or widgets horizontally, use the row() function.
from bokeh.layouts import row
from bokeh.plotting import figure, show

x = list(range(11))
y0 = x
y1 = [10 - i for i in x]
y2 = [abs(i - 5) for i in x]

# create three plots
s1 = figure(width=250, height=250, background_fill_color="#fafafa")
s1.circle(x, y0, size=12, color="#53777a", alpha=0.8)

s2 = figure(width=250, height=250, background_fill_color="#fafafa")
s2.triangle(x, y1, size=12, color="#c02942", alpha=0.8)

s3 = figure(width=250, height=250, background_fill_color="#fafafa")
s3.square(x, y2, size=12, color="#d95b43", alpha=0.8)

# put the results in a row and show
show(row(s1, s2, s3))
Grid layout for plots#
Use the gridplot() function to arrange Bokeh plots in a grid. This
function also merges all plot tools into a single toolbar. Each plot
in the grid then has the same active tool.
You can leave grid cells blank by passing None to them instead of
a plot object.
from bokeh.layouts import gridplot
from bokeh.plotting import figure, show

x = list(range(11))
y0 = x
y1 = [10 - i for i in x]
y2 = [abs(i - 5) for i in x]

# create three plots
s1 = figure(background_fill_color="#fafafa")
s1.circle(x, y0, size=12, alpha=0.8, color="#53777a")

s2 = figure(background_fill_color="#fafafa")
s2.triangle(x, y1, size=12, alpha=0.8, color="#c02942")

s3 = figure(background_fill_color="#fafafa")
s3.square(x, y2, size=12, alpha=0.8, color="#d95b43")

# make a grid
grid = gridplot([[s1, s2], [None, s3]], width=250, height=250)

show(grid)
For convenience, you can also just pass a list of plots and specify the number of columns you want in your grid. For example:
gridplot([s1, s2, s3], ncols=2)
You can also pass in width and height arguments.
These dimensions will then apply to all your plots.
By default, gridplot() merges all child plot tools into a single
parent grid toolbar. To disable this behavior, set merge_tools
to False.
from bokeh.layouts import gridplot
from bokeh.plotting import figure, show

x = list(range(11))
y0 = x
y1 = [10 - i for i in x]
y2 = [abs(i - 5) for i in x]

# create three plots
s1 = figure(background_fill_color="#fafafa")
s1.circle(x, y0, size=12, alpha=0.8, color="#53777a")

s2 = figure(background_fill_color="#fafafa")
s2.triangle(x, y1, size=12, alpha=0.8, color="#c02942")

s3 = figure(background_fill_color="#fafafa")
s3.square(x, y2, size=12, alpha=0.8, color="#d95b43")

# make a grid
grid = gridplot([s1, s2, s3], ncols=2, width=250, height=250)

show(grid)
General grid layout#
You can use the layout() function to arrange plots and widgets into a grid.
This automatically generates appropriate row() and column() layouts saving
you time. Try the following code to see how this function works.
sliders = column(amp, freq, phase, offset)

layout([
    [bollinger],
    [sliders, plot],
    [p1, p2, p3],
])
This produces the following layout:
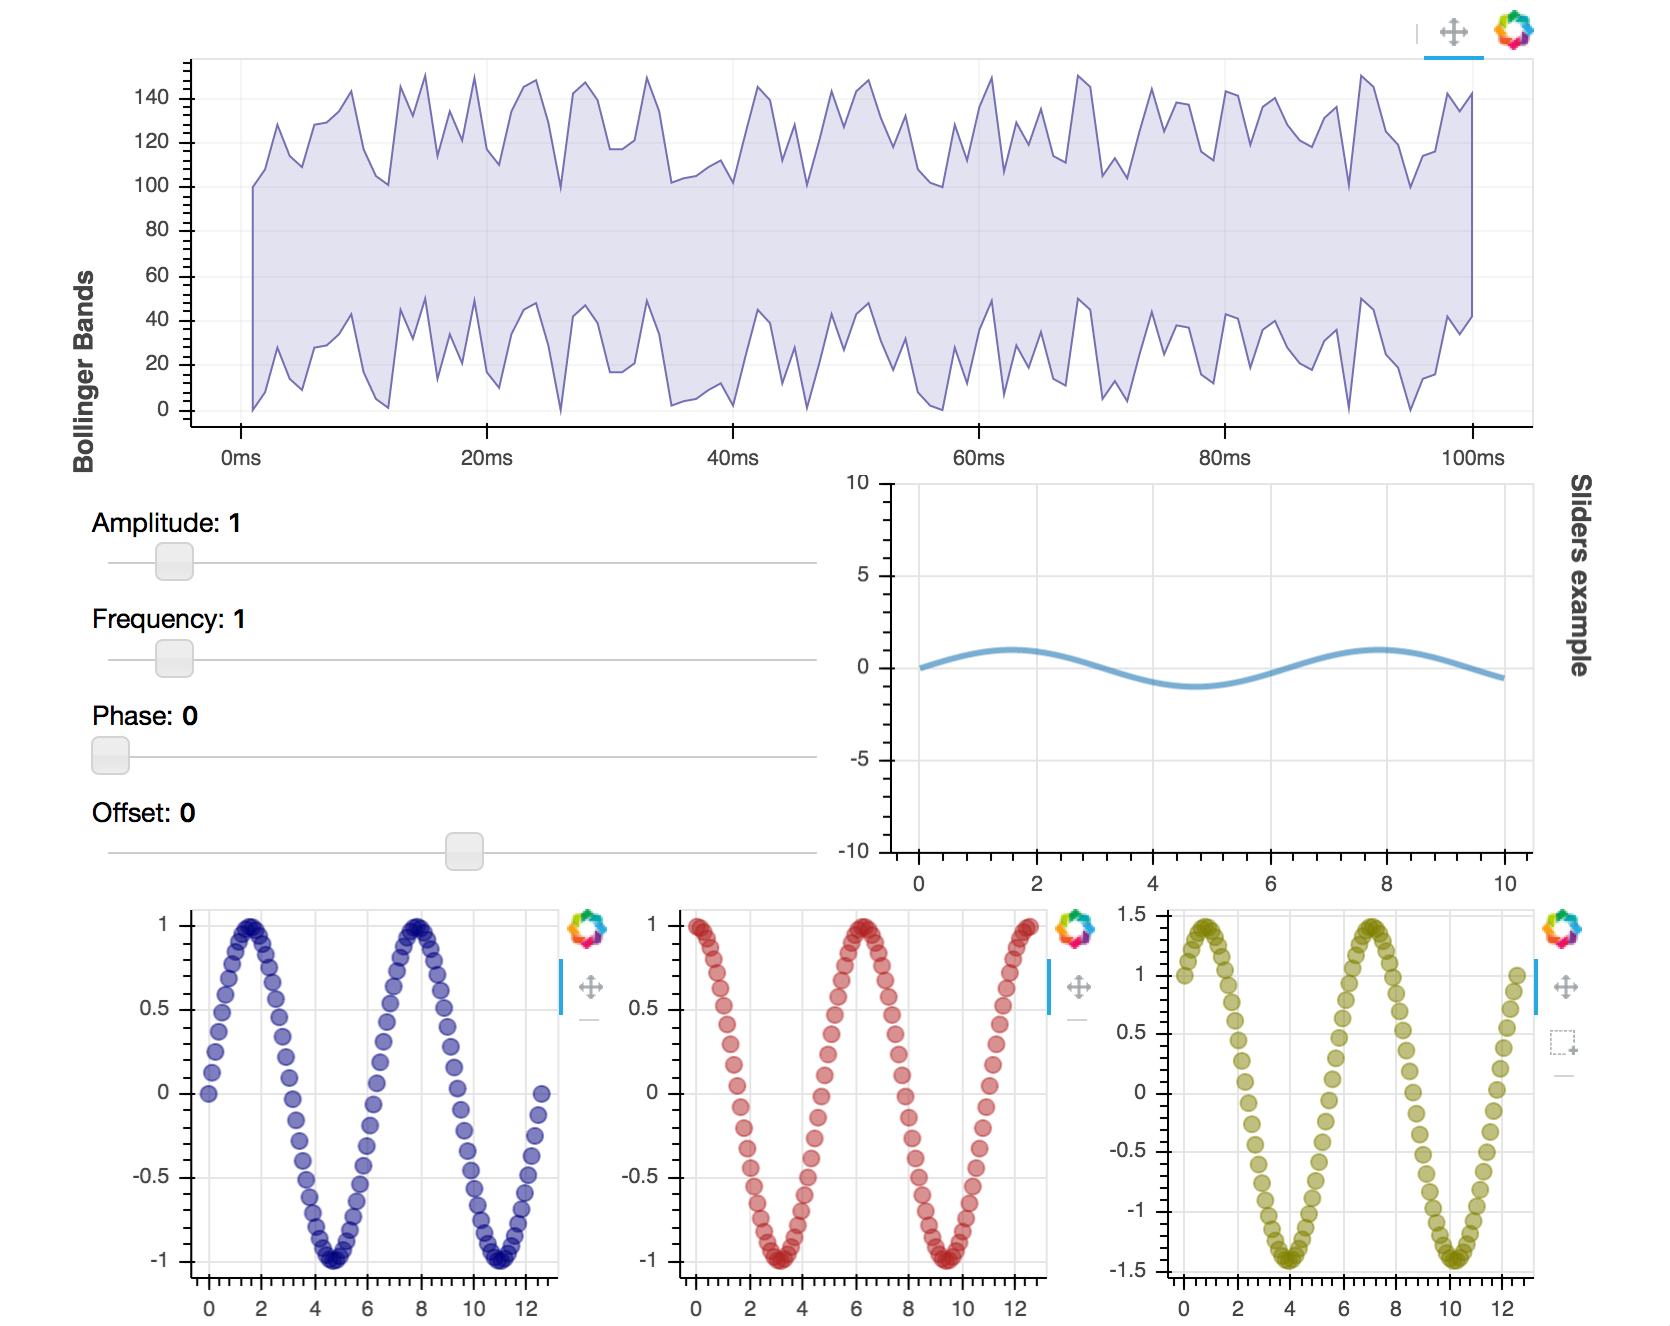
For complete code see examples/basic/layouts/dashboard.py.
Sizing modes#
Modes#
Use the following sizing modes to configure how Bokeh objects behave in a layout:
"fixed"Component retains its width and height regardless of browser window size.
"stretch_width"Component resizes to fill available width but does not maintain any aspect ratio. Height depends on the component type and may fit its contents or be fixed.
"stretch_height"Component resizes to fill available height but does not maintain any aspect ratio. Width depends on the component type and may fit its contents or be fixed.
"stretch_both"Component resizes to fill available width and height but does not maintain any aspect ratio.
"scale_width"Component resizes to fill available width and maintains either original or specified aspect ratio.
"scale_height"Component resizes to fill available height and maintains either original or specified aspect ratio.
"scale_both"Component resizes to fill available width and height and maintains either original or specified aspect ratio.
Depending on the mode, you may also have to specify width and/or height.
For example, you have to specify a fixed height when using the stretch_width
mode.
Components such as row() and column() elements share their sizing mode with all
of their children that do not have their own explicit sizing mode.
Single object#
The example below lets you select a sizing mode from a dropdown and see how a single plot responds to different modes.
Note
If the enclosing DOM element does not define any specific height to fill, sizing modes that scale or stretch to height may shrink your plot to a minimum size.
Multiple objects#
Below is a more sophisticated but fairly typical example of a nested layout.
Here the layout includes sub-components with different sizing modes as follows:
# plot scales to original aspect ratio based on available width
plot = figure(..., sizing_mode="scale_width")

# slider fills all space available to it
amp = Slider(..., sizing_mode="stretch_both")

# fixed sized for the entire column
widgets = column(..., sizing_mode="fixed", height=250, width=150)

# heading fills available width
heading = Div(..., height=80, sizing_mode="stretch_width")

# entire layout fills all space available to it
layout = column(heading, row(widgets, plot), sizing_mode="stretch_both")
Limitations#
The Bokeh layout system is not an all-purpose layout engine. It intentionally sacrifices some capability to make common use cases and scenarios simple to express. Complicated layouts with many different sizing modes may yield undesirable results, both in terms of performance and visual appearance. For more involved designs, use methods provided in Web pages along with your own custom HTML templates. This will let you take advantage of more sophisticated CSS layout possibilities.