Leveraging Other Libraries
Bokeh integrates well with a wide variety of other libraries, allowing you to use the most appropriate tool for each task.
JavaScript
Bokeh generates JavaScript, and so Bokeh output can be combined with a wide variety of JavaScript libraries, such as PhosphorJS. Listing such libraries is beyond the scope of this document; it’s best just to try and see!
Datashader
A major strength of Bokeh is that it copies your data from Python directly into the browser, which makes it possible for the user to interact with the represented data quickly and responsively, even without a live Python process running. However, for plotting millions or billions of points, this strength can turn into a liability, because current web browsers are very limited in how much data they can feasibly work with. Moreover, the visual representation of such large datasets is often misleading due to overplotting and related issues.
Datashader is a separately available Python library that pre-renders even the largest datasets into a fixed-size raster image that faithfully represents the data’s distribution. Datashader includes tools and examples showing how to build interactive Bokeh plots that dynamically re-render these images when zooming and panning in Bokeh, making it practical to work with arbitrarily large datasets in a web browser.
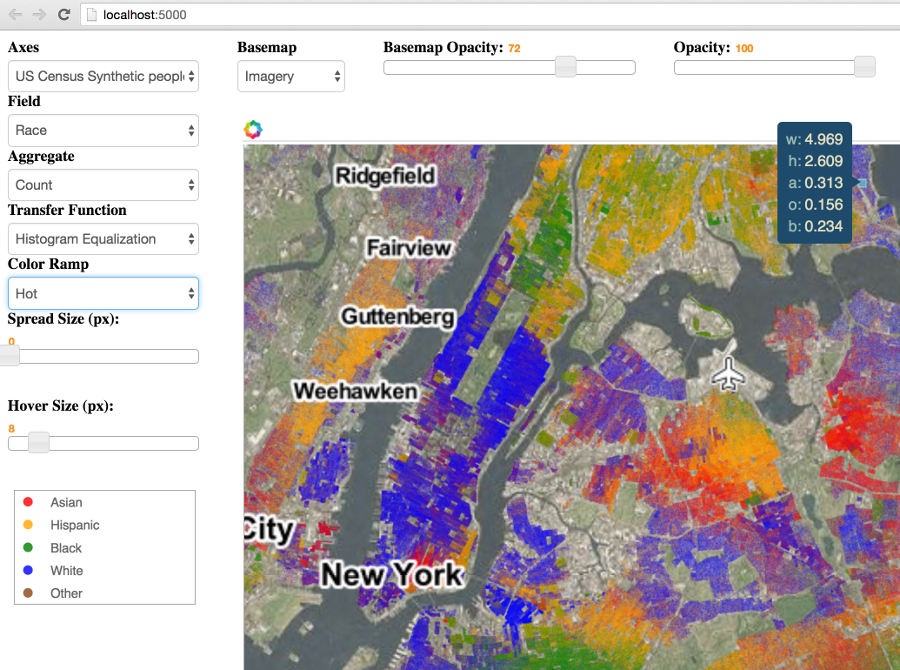
Datashader works well together with HoloViews (see below and this_example), which allows you to flexibly switch between datashaded and non-datashaded versions of a plot, interleave datashader-based plots with other Bokeh-based plots, and so on.
HoloViews
Bokeh is designed to provide an enormous amount of power and flexibility to the Python programmer, making it feasible to develop complex visualization-focused applications for deployment on web browsers. However, for day-to-day work exploring and visualizing data, it can be helpful to have a higher-level API on top of what Bokeh provides, to make it simpler to do common visualization tasks without specifying each step explicitly.
HoloViews is a separately maintained package that provides a concise declarative interface for building Bokeh plots. HoloViews is particularly focused on interactive use in a Jupyter notebook, allowing quick prototyping of figures for data analysis. For instance, to build an interactive figure with three linked Bokeh plots requires only one line of code in HoloViews:
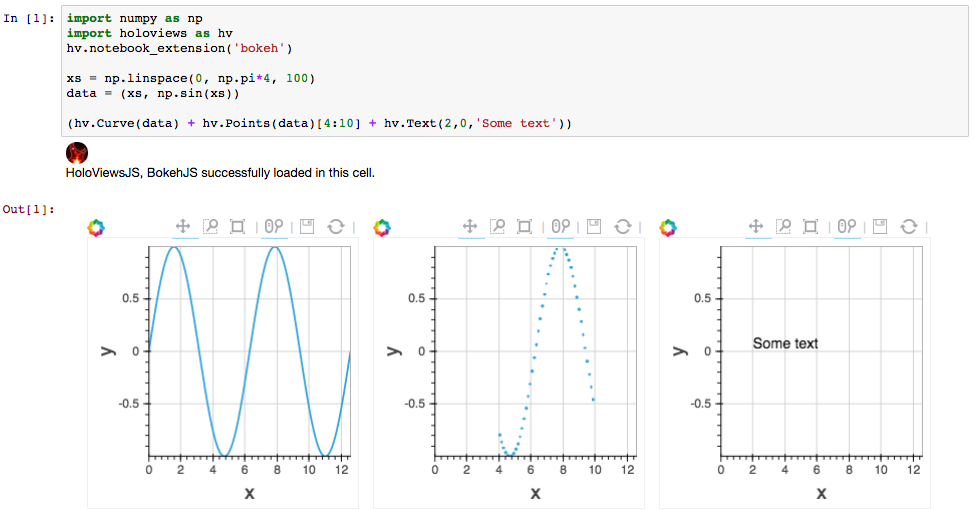
Adding overlaid plots, slider widgets, selector widgets, selection tools, and tabs is similarly straightforward. HoloViews objects can also be rendered using a Matplotlib-based backend, which allows SVG or PDF output not currently available for native Bokeh plots. See the Holoviews Bokeh_Backend tutorial for more details.