Third-party integrations#
Bokeh integrates well with a wide variety of other libraries, allowing you to use the most appropriate tool for each task.
BokehJS#
To display visualizations in a browser, Bokeh converts Python data and events to JSON and communicates them to its companion JavaScript library, BokehJS. You can also use BokehJS as a standalone library or in combination with JavaScript frameworks, such as React, Vue, Angular, and others.
See Developing with JavaScript for more information about BokehJS.
hvPlot#
hvPlot is a concise API that lets you plot in Bokeh with the pandas
.plot() function and a wide variety of data containers. This API is
particularly convenient for working with data interactively and lets
you quickly produce common types of plots.
Panel#
The Panel library provides a high-level reactive interface that makes it easy to build data-intensive dashboards and web applications on top of Bokeh. Panel enables full interoperability between Jupyter notebooks and Bokeh server. This lets you develop or prototype applications in a notebook and deploy them on a server. Panel also interfaces with other plotting libraries and lets you incorporate multiple data-science artifacts into a single Bokeh application. Furthermore, the library includes a number of JavaScript templates to let you customize the appearance your Bokeh apps.
HoloViews#
Bokeh offers you a lot of versatility when it comes to developing complex data visualizations for the web. Even so, a higher-level API can make day-to-day visualization tasks easier and less verbose.
HoloViews is a concise declarative interface that helps you build Bokeh plots. It is a separately maintained package that focuses on interaction with Jupyter notebooks and enables quick prototyping of figures for data analysis. For instance, building an interactive figure with three linked Bokeh plots requires only one line of code in HoloViews.
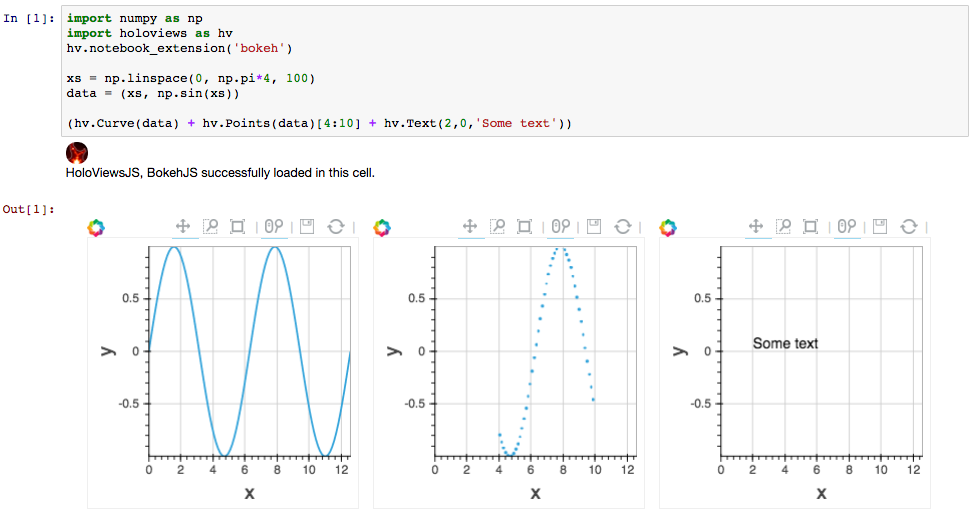
Adding overlaid plots, slider widgets, selector widgets, selection tools, and tabs is similarly straightforward.
Datashader#
By default, Bokeh copies datapoints from Python into a JavaScript process running in your browser to provide responsive, locally interactive plots. However, browsers can only handle limited amounts of data, making it infeasible to plot millions or billions of points directly in JavaScript. Moreover, typical plot-rendering techniques produce misleading plots for such large datasets, because of overplotting and related issues.
Datashader is a separate Python library that renders even the largest datasets as fixed-size raster images that faithfully represent the underlying data. Datashader gives you the tools to build interactive Bokeh plot images that dynamically re-render in Python when you zoom and pan. This approach lets you display interactive visualizations of arbitrarily large datasets in standard web browsers.
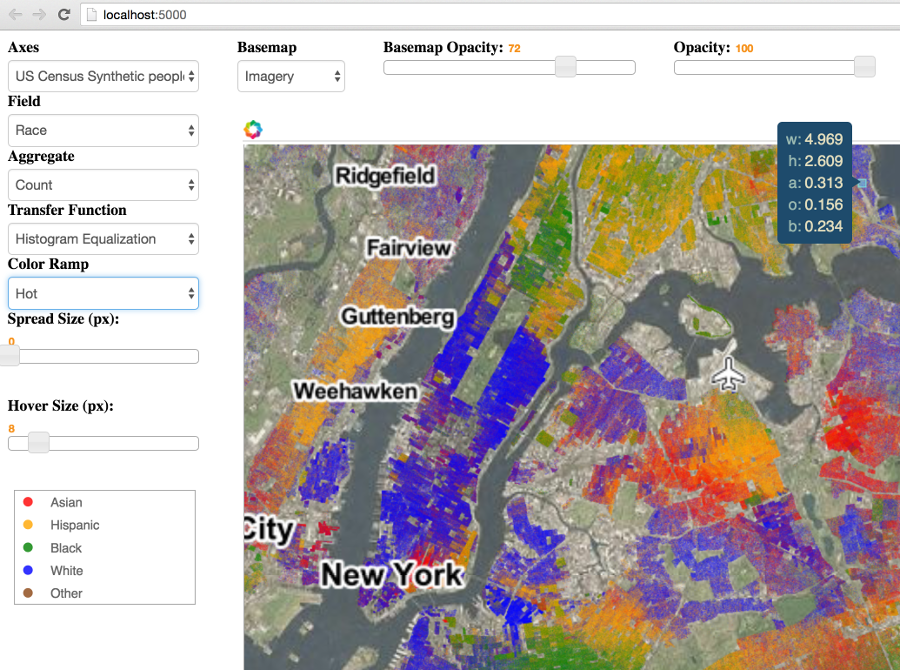
Furthermore, Datashader works well with hvPlot and HoloViews. This lets you switch between base and rendered versions of a plot, interleave Datashader and Bokeh plots, and more. Here is an example of interaction HoloViews.