Geographical data#
Bokeh supports creating map-based visualizations and working with geographical data.
Tile provider maps#
Bokeh is compatible with several XYZ tile services that use the Web Mercator projection.
Bokeh uses the xyzservices library to take care of the tile sources and their attributions.
To add these to a plot, use the method add_tile(). You can pass
any name xyzservices may recognize. The retina keyword can control the resolution of tiles.
from bokeh.plotting import figure, show

# range bounds supplied in web mercator coordinates
p = figure(x_range=(-2000000, 2000000), y_range=(1000000, 7000000),
           x_axis_type="mercator", y_axis_type="mercator")

p.add_tile("CartoDB Positron", retina=True)

show(p)
If you pass retina=True, Bokeh will attempt to use the tiles in the 2x higher resolution
than with default settings. However, this functionality needs to be supported by the tile provider.
Otherwise, the keyword is ignored. Alternatively, you can include 'retina'` as part of the tile
provider name string, e.g. ``'CartoDB Positron retina', which will work as retina=True.
Notice that passing x_axis_type="mercator" and y_axis_type="mercator"
to figure generates axes with latitude and longitude labels, instead of raw Web
Mercator coordinates.
Alternatively, you can use any xyzservices.TileProvider, either pre-defined in
xyzservices or a custom one.
import xyzservices.providers as xyz

from bokeh.plotting import figure, show

# range bounds supplied in web mercator coordinates
p = figure(x_range=(-2000000, 6000000), y_range=(-1000000, 7000000),
           x_axis_type="mercator", y_axis_type="mercator")
p.add_tile(xyz.OpenStreetMap.Mapnik)

show(p)
The available built-in tile providers are listed in the xyzservices documentation or
interactively as an xyzservices.providers module.
Representative samples of the most common tile providers are shown below.
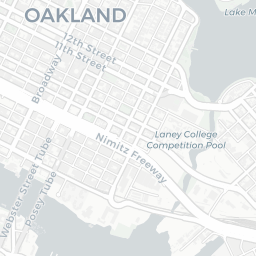
CartoDB Positron#
Tile Source for CartoDB Tile Service
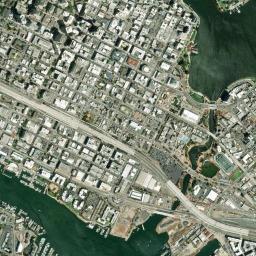
Esri World Imagery#
Tile Source for ESRI public tiles.
OSM#
Tile Source for Open Street Map Mapnik.

Stamen Terrain#
Tile Source for Stamen Terrain Service

Stamen Toner#
Tile Source for Stamen Toner Service

Stamen Toner Background#
Tile Source for Stamen Toner Background Service which does not include labels

Stamen Toner Labels#
Tile Source for Stamen Toner Service which includes only labels

Google Maps#
To plot glyphs over a Google Map, use the function gmap().
For the function to work, you must pass it a Google API Key and configure the Google Map underlay GMapOptions.
The Google API Key will be stored in the Bokeh Document JSON.
from bokeh.models import ColumnDataSource, GMapOptions
from bokeh.plotting import gmap, show

map_options = GMapOptions(lat=30.2861, lng=-97.7394, map_type="roadmap", zoom=11)

# For GMaps to function, Google requires you obtain and enable an API key:
#
#     https://developers.google.com/maps/documentation/javascript/get-api-key
#
# Replace the value below with your personal API key:
p = gmap("GOOGLE_API_KEY", map_options, title="Austin")

source = ColumnDataSource(
    data=dict(lat=[ 30.29,  30.20,  30.29],
              lon=[-97.70, -97.74, -97.78])
)

p.circle(x="lon", y="lat", size=15, fill_color="blue", fill_alpha=0.8, source=source)

show(p)
Note
Any use of Bokeh with Google Maps must be within Google’s Terms of Service.
Google Maps exerts explicit control over aspect ratios at all
times, which imposes some limitations on GMapPlot:
Only
Range1dranges are supported. Attempting to use other range types will result in an error.Usage of
BoxZoomToolis incompatible withGMapPlotand adding one will have no effect.
GeoJSON data#
GeoJSON is a popular open standard for representing geographical features with JSON. It describes points, lines, and polygons (called Patches in Bokeh) as a collection of features. Each feature can also have a set of properties.
Bokeh’s GeoJSONDataSource can be used almost seamlessly in place of Bokeh’s
ColumnDataSource. For example:
import json

from bokeh.models import GeoJSONDataSource
from bokeh.plotting import figure, show
from bokeh.sampledata.sample_geojson import geojson

data = json.loads(geojson)

for i in range(len(data['features'])):
    data['features'][i]['properties']['Color'] = ['blue', 'red'][i%2]

geo_source = GeoJSONDataSource(geojson=json.dumps(data))

TOOLTIPS = [('Organisation', '@OrganisationName')]

p = figure(background_fill_color="lightgrey", tooltips=TOOLTIPS)

p.circle(x='x', y='y', size=15, color='Color', alpha=0.7, source=geo_source)

show(p)
Warning
Bokeh converts the GeoJSON coordinates into columns called
x and y or xs and ys (depending on whether the features are Points,
Lines, MultiLines, Polygons, or MultiPolygons). Properties with clashing names
will be overridden when the GeoJSON is converted and should be avoided.