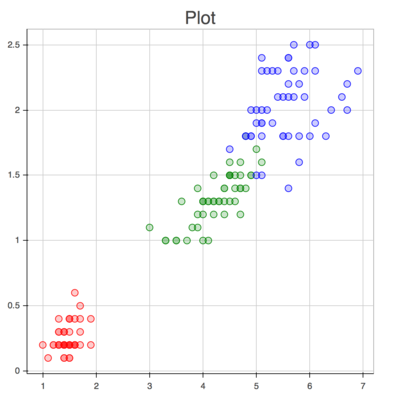
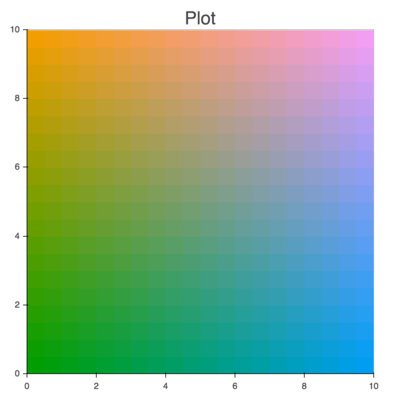
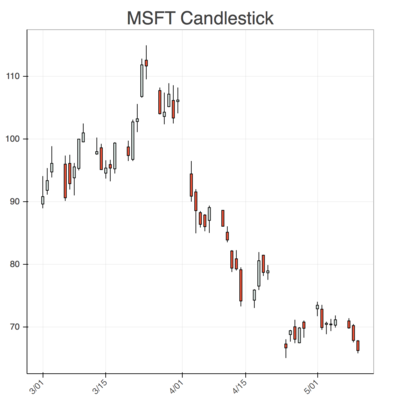
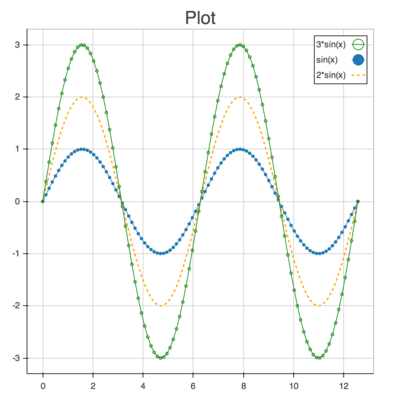
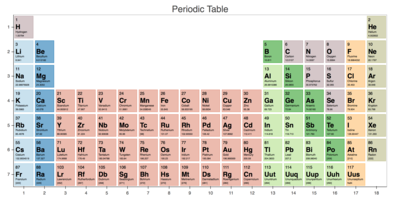
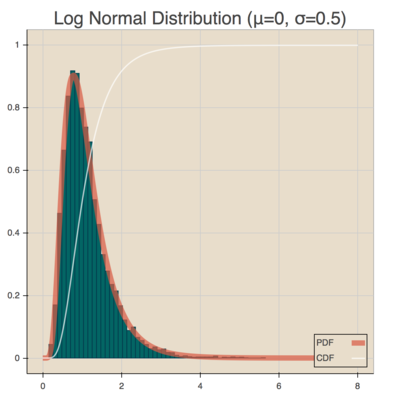
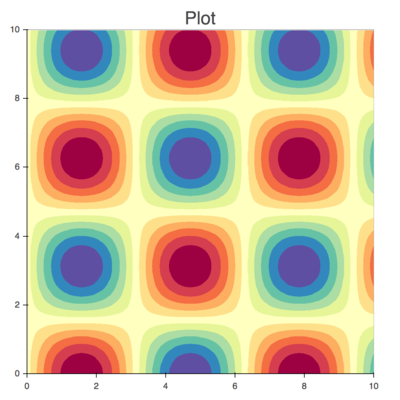
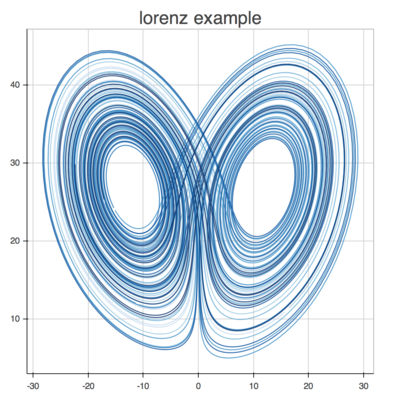
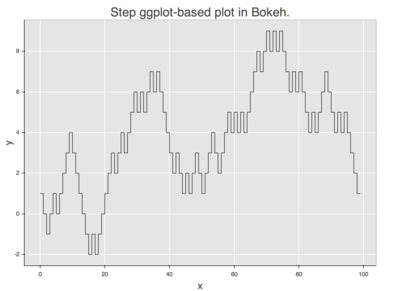
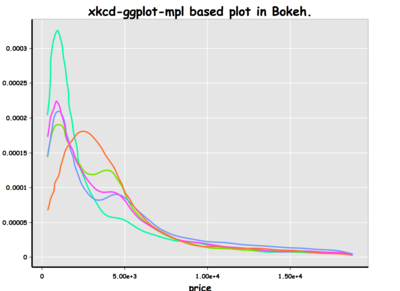
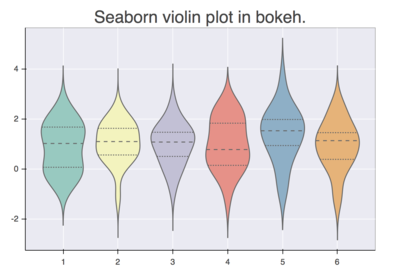
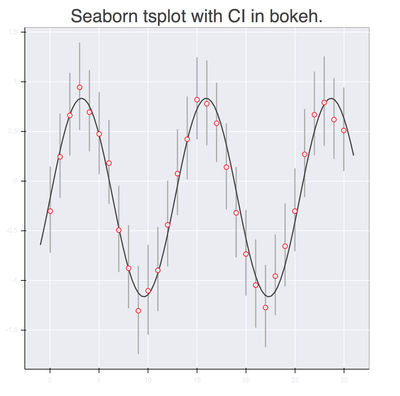
Bokeh 0.9.3
  • Gallery
  • Site
    • Quickstart
      • Introduction
      • Quick Installation
      • Getting Started
      • Jupyter Notebooks
      • Other Languages
      • Sample Data
      • Concepts
        • Plot
        • Glyphs
        • Guides and Annotations
        • Ranges
        • Resources
      • More examples
        • Vectorized colors and sizes
        • Linked panning and brushing
        • Datetime axes
      • Bokeh Plot Server
      • What’s next?
    • Installation
      • Dependencies
      • Package Installs
      • Sample Data
      • Notes for Windows Users
      • Installing from Source
      • Developer Builds
      • BokehJS Standalone
    • Gallery
      • Crossfilter Example
      • Sliders Example
      • Stocks Example
      • Server Examples
      • Static Examples
    • User Guide
      • Getting Set Up
        • Installing the Bokeh Library
        • Verifying your installation
        • Finding Help
      • Defining Key Concepts
        • Glossary
        • Interfaces
      • Plotting with Basic Glyphs
        • Creating Figures
        • Combining Multiple Glyphs
        • Setting Ranges
        • Specifying Axis Types
        • Adding Annotations
      • Using High-level Charts
        • Generic Arguments
        • Creating Charts
      • Leveraging Other Libraries
        • Overview
        • Matplotlib
        • Pandas
        • Seaborn
        • ggplot.py
      • Styling Visual Attributes
        • Using Palettes
        • Visual Properties
        • Selecting Plot Objects
        • Plots
        • Glyphs
        • Axes
        • Grids
        • Legends
      • Configuring Plot Tools
        • Positioning the Toolbar
        • Specifying Tools
        • Setting Tool Visuals
        • Controlling Level of Detail
      • Laying Out Multiple Plots
        • Vertical Layout
        • Horizontal Layout
        • Grid Layout
        • Form Layout
      • Working in the Notebook
        • Displaying Inline Plots
        • Connecting to Bokeh Server Plots
        • Integrating IPython Interactors
      • Adding Interactions
        • Linking Plots
        • Adding Widgets
        • Defining Callbacks
      • Deploying the Bokeh Server
        • Overview
        • Concepts
        • Running the Example Server
        • Storing plots on the server
        • Authenticating Users
        • Publishing to the Server
        • Streaming Data with the Server
        • Downsampling with Server
        • Reacting to User Interactions
        • Building Bokeh Applications
        • Deploying for Production
      • Embedding Bokeh Plots
        • Standalone HTML
        • Components
        • IPython Notebook
        • Autoloading
      • Learning More
    • Tutorials
    • Developer Guide
      • Software Process
      • Building and Installing
        • Cloning the Repository
        • Building BokehJS
        • Python Setup
        • Incremental Compilation
      • Documentation
        • Requirements
        • Building
        • Conventions
      • Testing
      • Bokeh Objects
        • Low-level Object Interface
        • Models and properties
      • BokehJS
        • BokehJS Motivations
        • Goals
        • Interface
        • Dependencies
        • Examples
      • Language Bindings
        • Resources for Authors
        • Known Bindings
      • Notes
        • Environment Variables
        • CSS class names
        • Managing examples
        • Choosing right types
        • Managing Python modules
        • Managing external JS libraries
        • Maintaining secure variables in .travis.yml
        • Browser caching
        • BokehJS AMD module template for a model
      • Bokeh Server Architecture
        • Data Model
        • Copy on Write
        • Anonymous Users
    • Contributing
      • Core Team
    • Frequently Asked Questions
      • General Questions
        • How do you pronounce “bokeh”?
        • Why did you start writing a new plotting library?
        • Can I incorporate Bokeh into my proprietary app or platform?
        • What is the relationship between Bokeh and Chaco?
        • How does Bokeh compare to mpld3?
        • Does Bokeh implement R’s ggplot2?
      • Technical Questions
        • Does Bokeh use D3.js?
        • Why not use something like Vega?
        • How do I get the sample data?
      • Troubleshooting
        • Are the tools not working in Chrome/Cromium?
    • Release Notes and Roadmap
      • Release Notes
        • 0.9.3 (Aug 2015)
        • 0.9.2 (Jul 2015)
        • 0.9.1 (Jul 2015)
        • 0.9.0 (May 2015)
        • 0.8.2 (Mar 2015)
        • 0.8.1 (Feb 2015)
        • 0.8.0 (Feb 2015)
        • 0.7.1 (Jan 2015)
        • 0.7.0 (Dec 2014)
        • 0.6.1 (Sep 2014)
        • 0.6.0 (Sep 2014)
        • 0.5.2 (Aug 2014)
        • 0.5.1 (Jul 2014)
        • 0.5.0 (Jul 2014)
        • 0.4.4 (Apr 2014)
        • 0.4.2 (Mar 2014)
        • 0.4.1 (Feb 2014)
        • 0.4.0 (Feb 2014)
        • 0.3.0 (Nov 2013)
        • 0.2.0 (Oct 2013)
        • 0.1.0 (Apr 2013)
      • Roadmap
        • Long-term TODO List
    • Reference Guide
      • Properties System
        • bokeh.properties
        • bokeh.mixins
      • bokeh.models Interface
        • bokeh.models.annotations
        • bokeh.models.axes
        • bokeh.models.callbacks
        • bokeh.models.formatters
        • bokeh.models.glyphs
        • bokeh.models.grids
        • bokeh.models.map_plots
        • bokeh.models.mappers
        • bokeh.models.markers
        • bokeh.models.plots
        • bokeh.models.ranges
        • bokeh.models.renderers
        • bokeh.models.sources
        • bokeh.models.tickers
        • bokeh.models.tools
        • bokeh.models.widget
        • bokeh.models.widgets.buttons
        • bokeh.models.widgets.dialogs
        • bokeh.models.widgets.groups
        • bokeh.models.widgets.icons
        • bokeh.models.widgets.inputs
        • bokeh.models.widgets.layouts
        • bokeh.models.widgets.markups
        • bokeh.models.widgets.panels
        • bokeh.models.widgets.tables
      • bokeh.validation Package
        • bokeh.validation.errors
        • bokeh.validation.warnings
        • bokeh.validation.decorators
        • bokeh.validation.exceptions
      • bokeh.plotting Interface
      • bokeh.charts Interface
        • Chart Functions
        • Helper Classes
        • Builders
      • Standard Palettes
      • Resources and Embedding
        • bokeh.state
        • bokeh.io
        • bokeh.resources
        • bokeh.embed
        • bokeh.templates
      • Plot Objects
        • bokeh
        • bokeh.document
        • bokeh.session
      • Bokeh Server REST API
      • BokehJS Interface Reference
        • Data Sources
        • Line Properties
        • Fill Properties
        • Text Properties
        • Markers
        • Glyphs
      • Sphinx Extensions
        • bokeh_autodoc
        • bokeh_gallery
        • bokeh_github
        • bokeh_model
        • bokeh_palette
        • bokeh_plot
        • bokeh_prop
        • collapsible_code_block
  • Page
    • Gallery
    • Server Examples
    • Static Examples

Gallery

Server Examples

The examples linked below all show off usage of the Bokeh server. The Bokeh server provides a place where interesting things can happen—data can be updated to in turn update the plot, and UI and selection events can be processed to trigger more visual updates. It is also possible to downsample large data sets or stream continuously updating data from the Bokeh server.

  • Sliders Example.
  • Crossfilter Example.
  • Stocks Example.

Static Examples

All of the static examples below are located in the examples subdirectory of your Bokeh checkout. By “static”, we simply mean that no use is made of the Bokeh server. Static plots can still have many interactive tools and features, including linked panning and brushing, and hover inspectors.

Click on an image below to see its code and interact with the live plot.

  • iris
  • image_rgba
  • candlestick
  • legend
  • correlation
  • box_annotation
  • les_mis
  • unemployment
  • stocks
  • streamline
  • quiver
  • categorical
  • periodic
  • histogram
  • image
  • lorenz
  • color_scatter
  • iris_splom
  • anscombe
  • choropleth
  • texas
  • scatter
  • burtin
  • brewer
  • elements
  • boxplot
  • area_chart
  • boxplot_chart
  • cat_heatmap_chart
  • donut_chart
  • dot_chart
  • histograms_chart
  • iris_scatter_chart
  • line_chart
  • palettes
  • stacked_bar_chart
  • step_chart
  • stocks_timeseries_chart
  • density
  • ggplot_line
  • step
  • xkcd_density
  • violin
  • sinerror

Prev | Next | Back to top

Source

© Copyright 2013, Anaconda.
Created using Sphinx 1.3.1.