- Gallery
-
Site
- Quickstart
- Installation
- Bokeh Tutorial
- Gallery
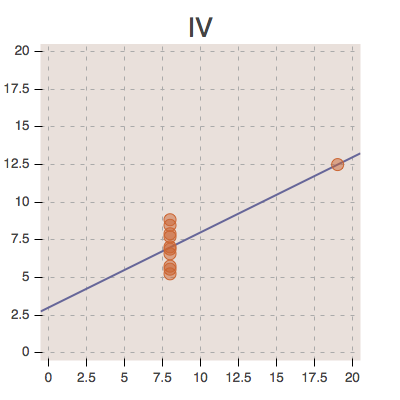
- anscombe
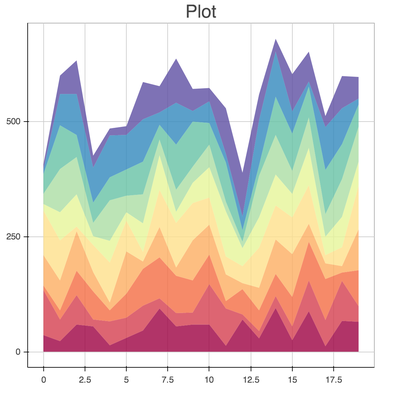
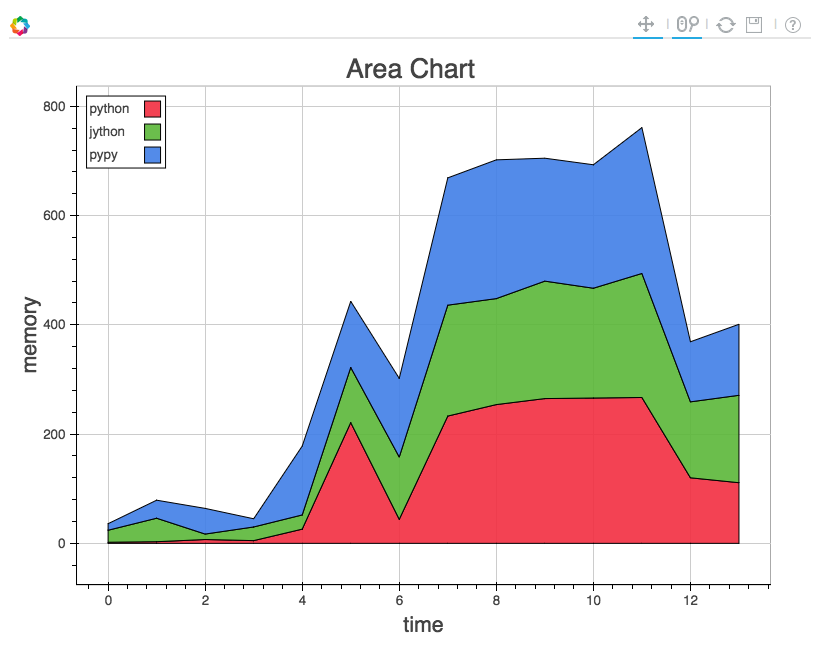
- area_chart
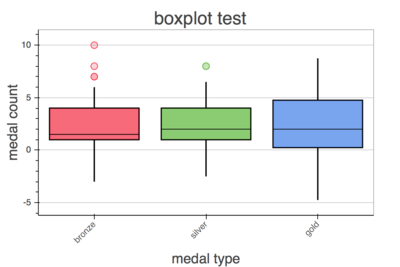
- boxplot
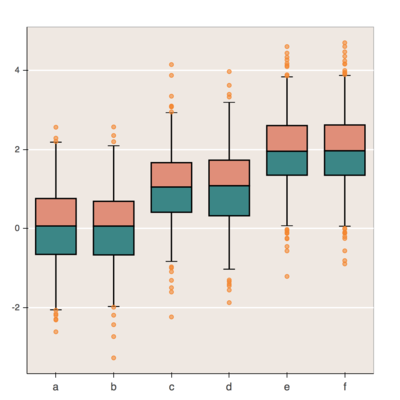
- boxplot_chart
- brewer
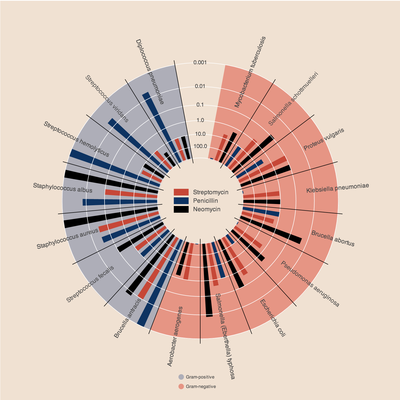
- burtin
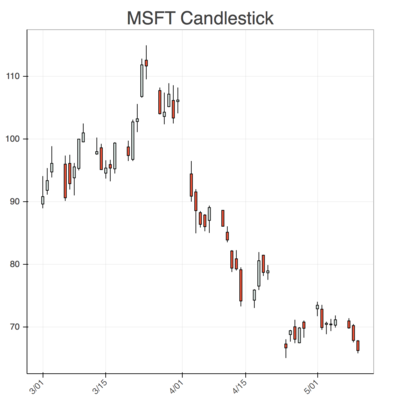
- candlestick
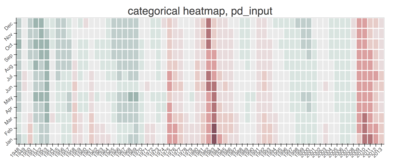
- cat_heatmap_chart
- categorical
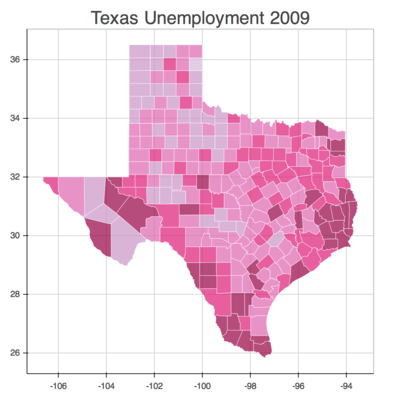
- choropleth
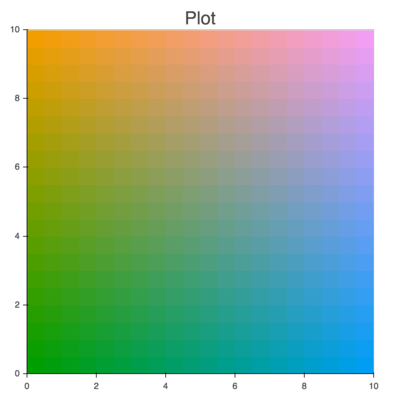
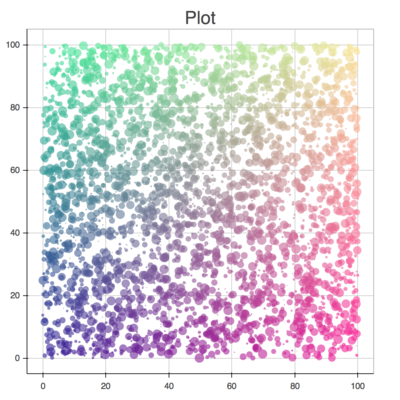
- color_scatter
- correlation
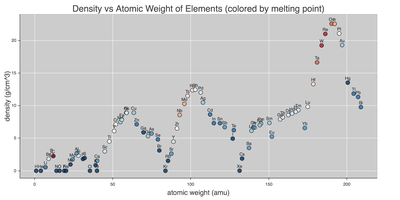
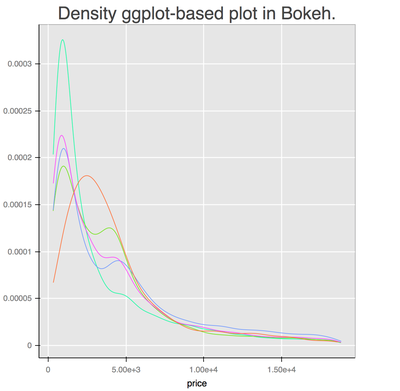
- density
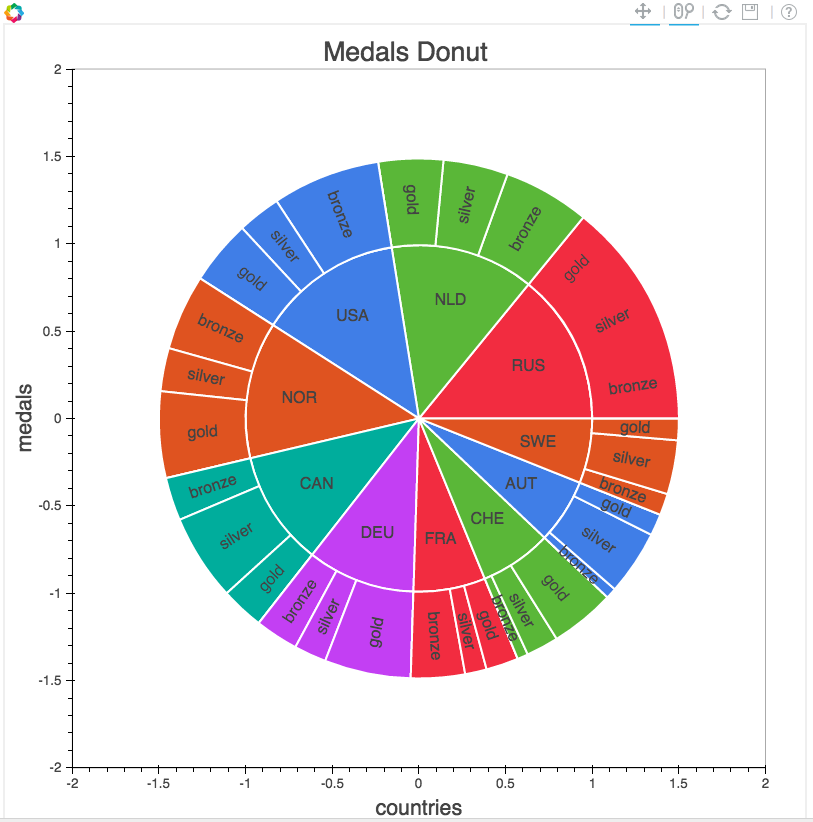
- donut_chart
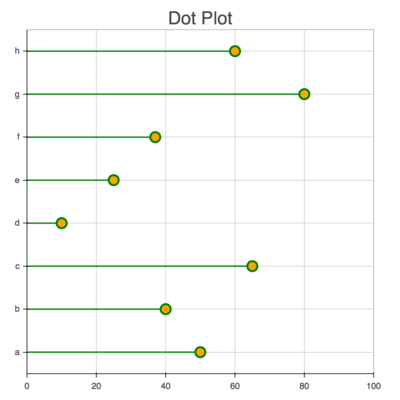
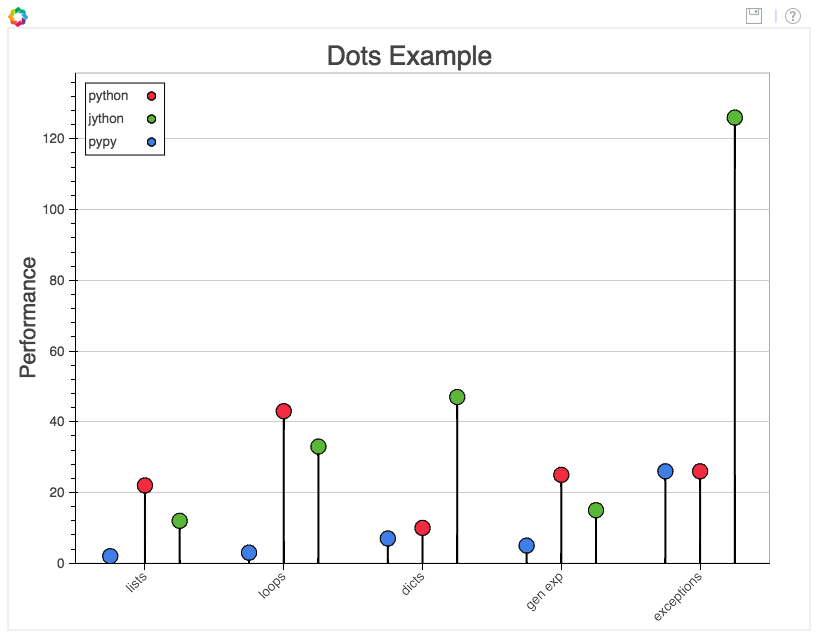
- dot_chart
- elements
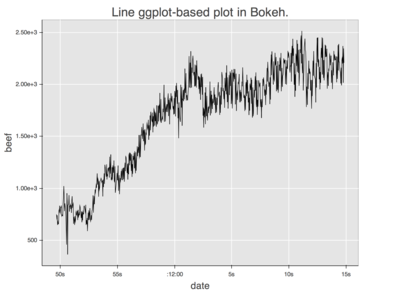
- ggplot_line
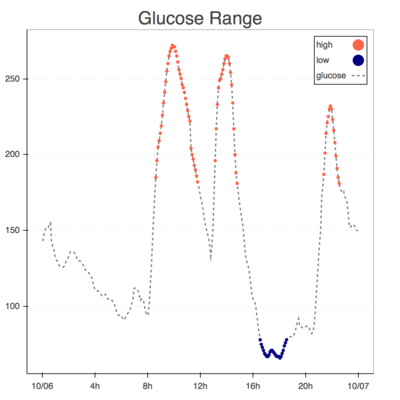
- glucose
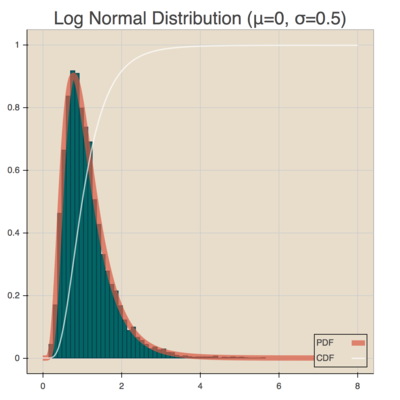
- histogram
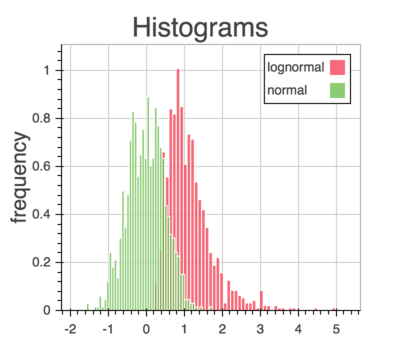
- histograms_chart
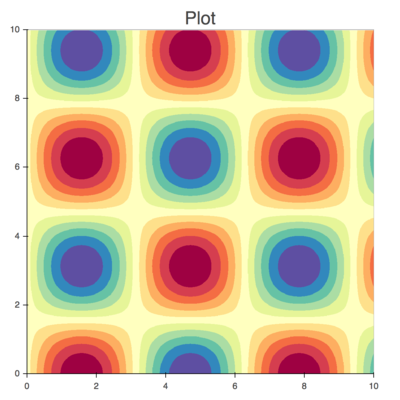
- image
- image_rgba
- iris
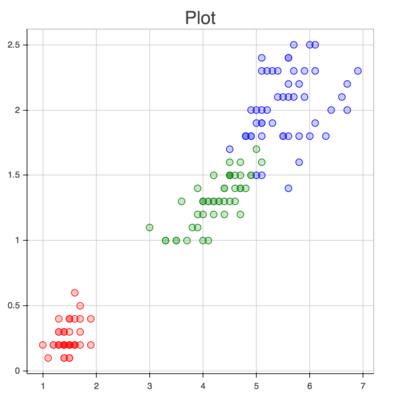
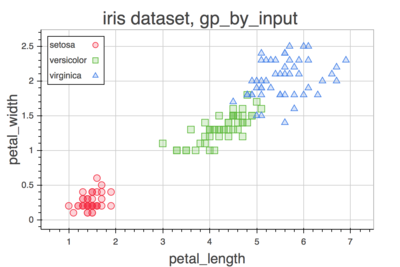
- iris_scatter_chart
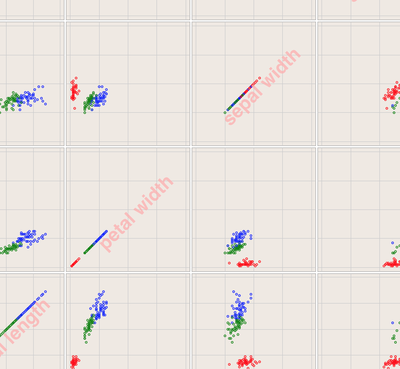
- iris_splom
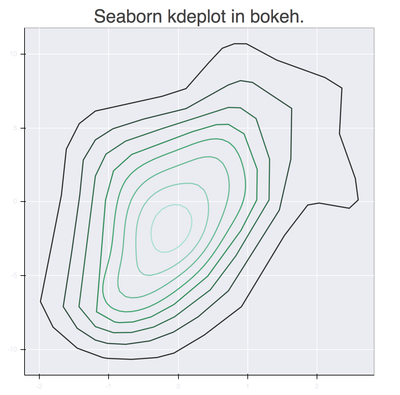
- kde
- legend
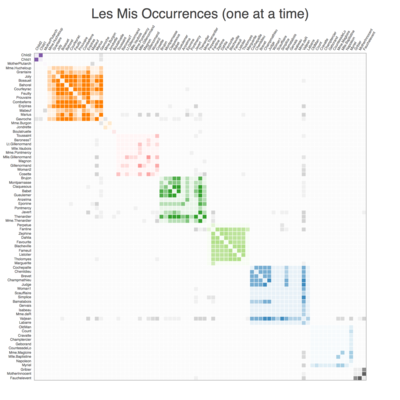
- les_mis
- line_chart
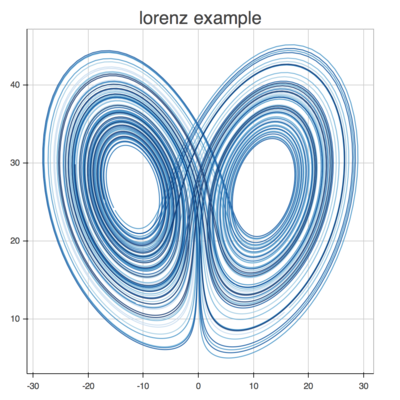
- lorenz
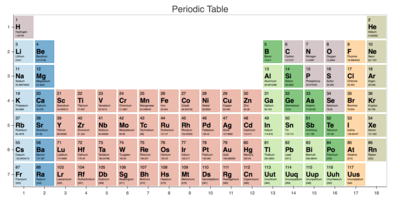
- periodic
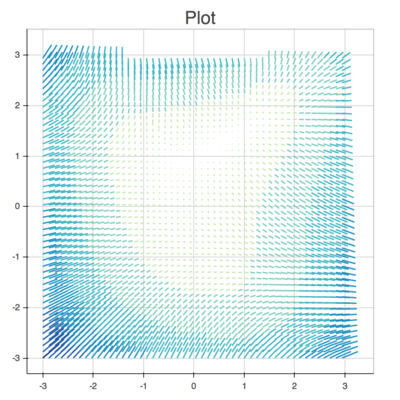
- quiver
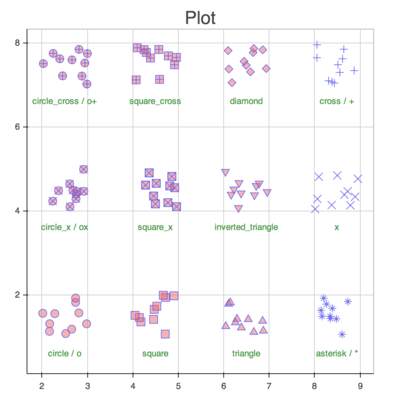
- scatter
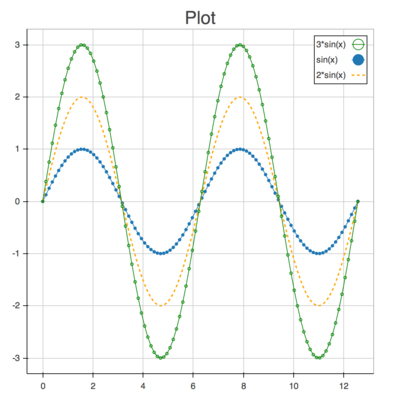
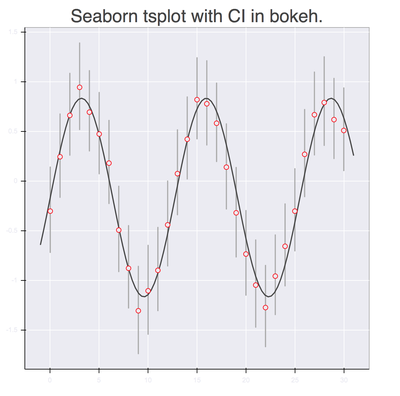
- sinerror
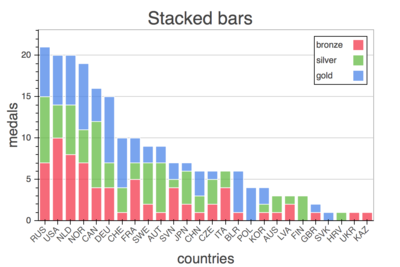
- stacked_bar_chart
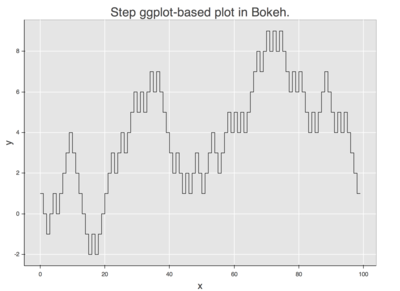
- step
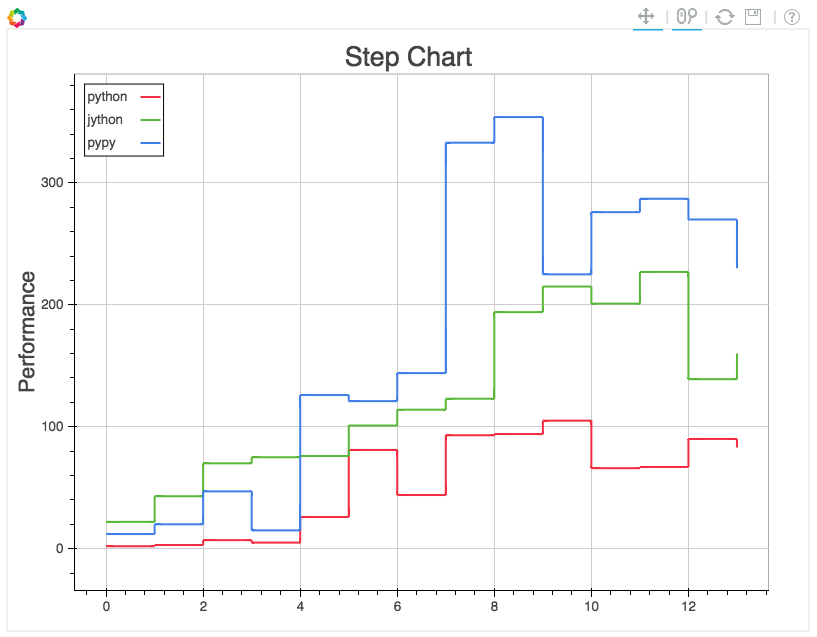
- step_chart
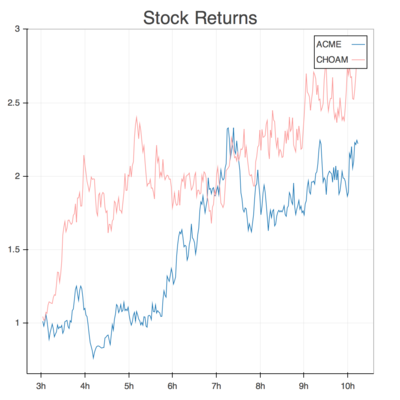
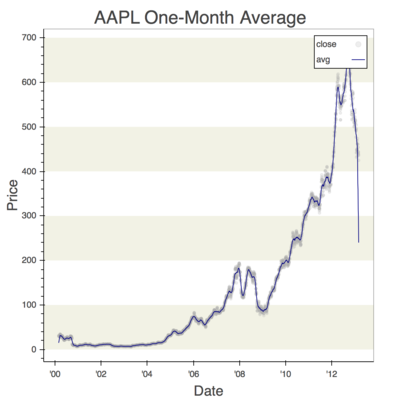
- stocks
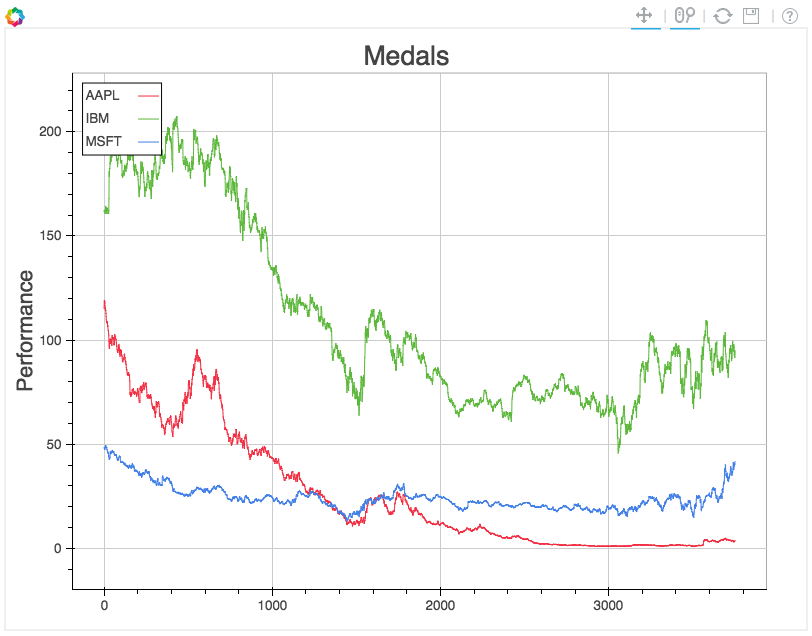
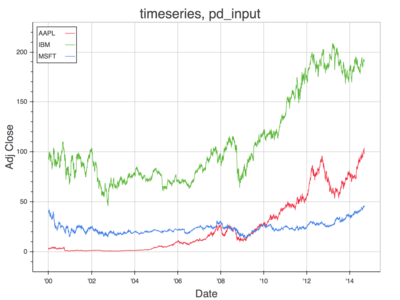
- stocks_timeseries_chart
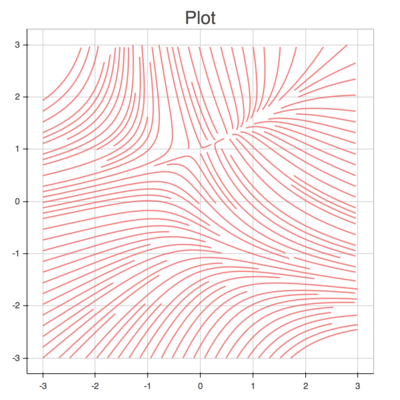
- streamline
- texas
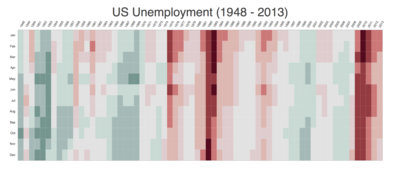
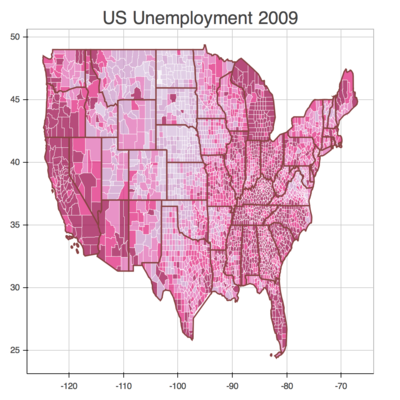
- unemployment
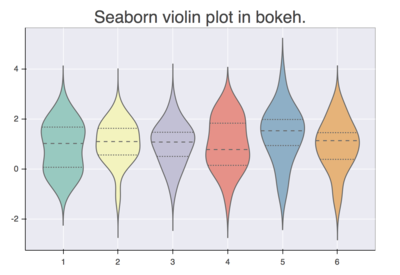
- violin
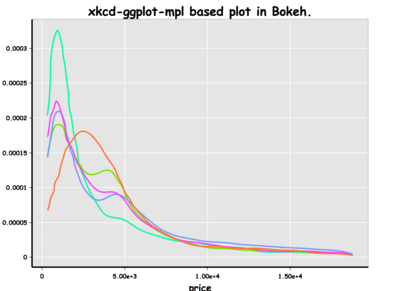
- xkcd_density
- Animated Glyph Example
- Crossfilter Example
- Animated Line Example
- Sliders Example
- Stocks Example
- Server Examples
- Static Examples
- User Guide
- Developer Guide
- Contributing
- Frequently Asked Questions
- Release Notes and Roadmap
- Reference Guide
- Page
- « solution
- anscombe »