High Level Charts

Warning

bokeh.charts interface is still new, and is very likely to change in upcoming releases. Although we always try to be consistent, we cannot guarantee backwards compatibility for now. Please take this into consideration when using it.

bokeh.charts provides a very high level API to create rich charts commonly used without having to access lower level components.

The current bokeh.charts interface implementation supports the following chart types:

  • Area (overlapped and stacked)
  • Bar (grouped and stacked)
  • BoxPlot
  • Donut
  • Dot
  • HeatMap
  • Histogram
  • Horizon
  • Line
  • Scatter
  • Step
  • Timeseries

To use them, you only have to import the chart factory of interest from bokeh.charts:

from bokeh.charts import Histogram

initialize your plot with the chart specific arguments to customize the chart:

mu, sigma = 0, 0.5
normal = np.random.normal(mu, sigma, 1000)
normal_dist = OrderedDict(normal=normal)
hist = Histogram(normal_dist, bins=50, mu=mu, sigma=sigma,
                 title="kwargs, dict_input", ylabel="frequency", legend="top_left",
                 width=400, height=350, notebook=True)

and finally call the show() method:

hist.show()

or use the plotting interface functions:

from bokeh.plotting import output_file, show
output_file('histogram.html')
show(hist)
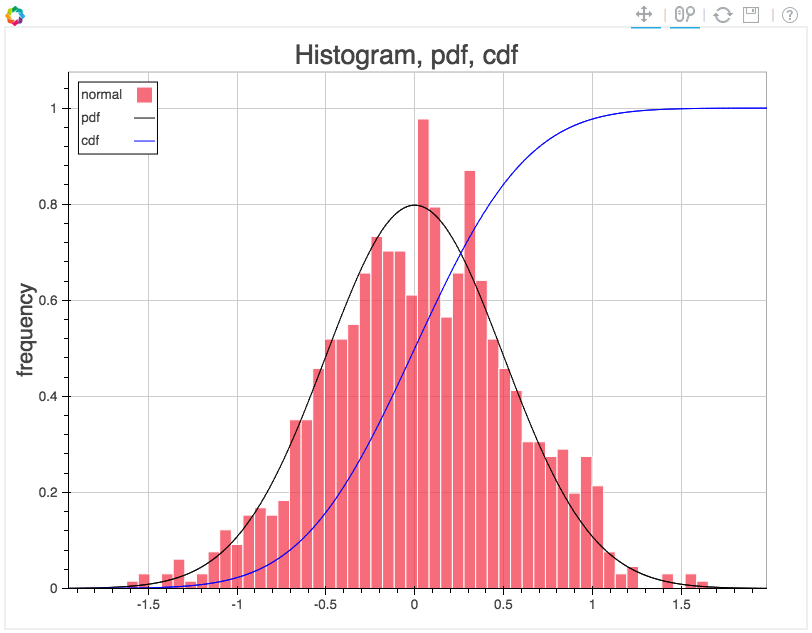
../../_images/charts_histogram_cdf.png

Generic arguments

Charts support a long list of arguments that you can pass when instantiating a class, as we have shown before. Available optional arguments are:

  • title (str): the title of your chart.
  • xlabel (str): the x-axis label of your chart.
  • ylabel (str): the y-axis label of your chart.
  • legend (str, bool): the legend of your chart.
  • xscale (str): the x-axis type scale of your chart.
  • yscale (str): the y-axis type scale of your chart.
  • xgrid (bool): whether to draw an x-grid.
  • ygrid (bool): whether to draw an y-grid.
  • width (int): the width of your plot in pixels.
  • height (int): the height of you plot in pixels.
  • tools (str or bool): to enable or disable the tools in your chart.
  • palette (list): a list containing the colormap as hex values.
  • filename (str or bool): the name of the file where your chart will be written.
  • server (str or bool): the name of your chart in the server.
  • notebook (bool):if you want to output (or not) your chart into the IPython notebook.

Interface inputs

bokeh.charts support any of the following:

  • list
  • dict
  • OrderedDict
  • numpy arrays
  • pandas DataFrame objects

In general inputs are supposed to be iterables representing each single data series values (i.e: list of lists, dict/ordered dict of lists, etc.. containing iterable of scalar values). The idea behind this canonical format is to easily represent groups of data and easily plot them through the interface.

Note

Scatter chart also supports pandas groupby objects as input. As we have mentioned bokeh.charts is still very experimental so the number of supported inputs is very likely to grow.

Here are a few examples showing charts using different kind of inputs:

  • Using a pandas groupby object (only supported by Scatter):

    from bokeh.sampledata.iris import flowers
    from bokeh.charts import Scatter
    
    df = flowers[["petal_length", "petal_width", "species"]]
    g = df.groupby("species")
    
    scatter = Scatter(g, filename="iris_scatter.html", title="iris dataset GroupBy")
    scatter.show()
    
  • Using OrderedDict (or dict-like objects):

    from collections import OrderedDict
    
    xyvalues = OrderedDict()
    for i in ['setosa', 'versicolor', 'virginica']:
        x = getattr(g.get_group(i), 'petal_length')
        y = getattr(g.get_group(i), 'petal_width')
        xyvalues[i] = list(zip(x, y))
    
    scatter = Scatter(xyvalues, filename="iris_scatter.html", title="iris dataset, OrderedDic")
    scatter.show()
    
  • Using a hierarchical pandas dataframe:

    import pandas as pd
    
    dfvalues = pd.DataFrame(xyvalues)
    
    scatter = Scatter(dfvalues, filename="iris_scatter.html", title="iris dataset, DataFrame")
    scatter.show()
    
  • Using a list:

    lxyvalues = xyvalues.values()
    
    scatter = Scatter(lxyvalues, filename="iris_scatter.html", title="iris dataset, List")
    scatter.show()
    
  • Using a numpy array:

    import numpy as np
    
    nxyvalues = np.array(xyvalues.values())
    
    scatter = Scatter(nxyvalues, filename="iris_scatter.html", title="iris dataset, Array")
    scatter.show()
    

All the previous examples render the chart in Scatter with the difference that numpy array and list inputs will render different legends from mappings like dict, OrderedDict, pandas DataFrame or GroupBy objects (if legend is True).

Specific arguments

For some chart types we support specific arguments which only make sense in that specific chart context. For instance, if you use a Timeseries chart, the x-value (index) for each group has to be datetime values. Or, if you want to use the Categorical HeatMap, columns names and the specified index have to be string type values.

Going ahead with a few more examples: as you have seen before, in the Histogram chart you need to setup the bins and, additionally, you can pass a mu and sigma to get the pdf and the cdf line plots of theoretical normal distributions for these parameters.

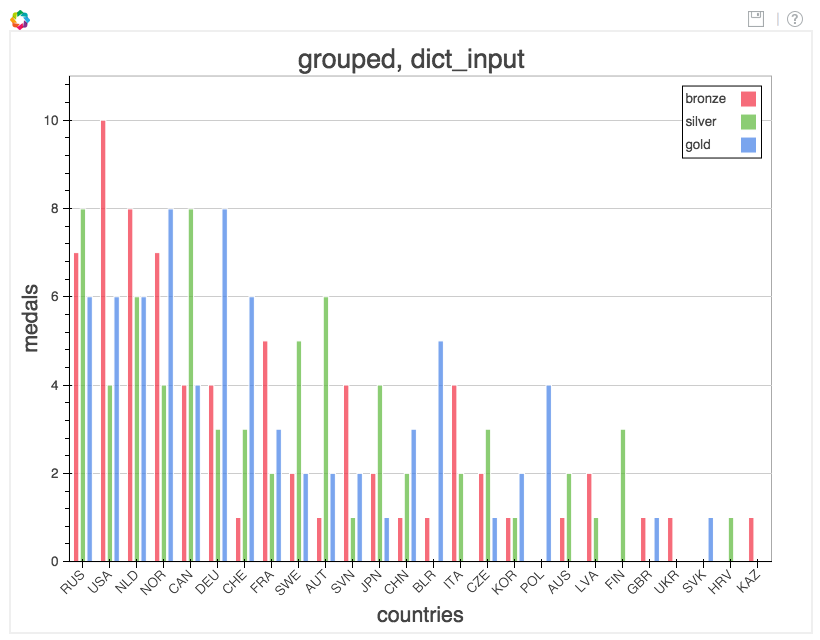
In the Bar charts case, if you pass several groups, they will be shown grouped by default:

../../_images/charts_bar_grouped.png

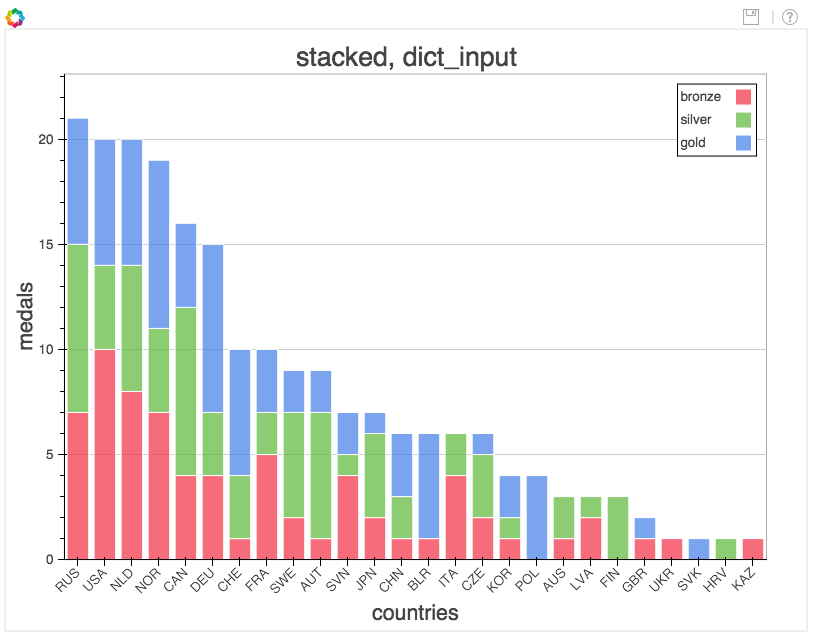
But if you specify the argument stacked as True, it will be shown as stacked bars as follows:

../../_images/charts_bar_stacked.png

So, besides the shared arguments specified in Generic arguments and the general Interface inputs we have listed in the previous paragraph, each class support the following custom arguments:

Area

  • values (see Interface inputs): data series to be plotted. Container values must be 1d iterable of scalars.
  • index (str | 1d iterable of any sort, optional): can be used to specify a common custom index for all data series as follows:
    • As a 1d iterable of any sort that will be used as series common index
    • As a string that corresponds to the key of the mapping to be used as index (and not as data series) if area.values is a mapping (like a dict, an OrderedDict or a pandas DataFrame)
  • stacked (bool, optional):
    • True: areas are draw as a stack to show the relationship of parts to a whole
    • False: areas are layered on the same chart figure. Defaults to False.

Example:

from collections import OrderedDict

from bokeh.charts import Area, show, output_file

# create some example data
xyvalues = OrderedDict(
    python=[2, 3, 7, 5, 26, 221, 44, 233, 254, 265, 266, 267, 120, 111],
    pypy=[12, 33, 47, 15, 126, 121, 144, 233, 254, 225, 226, 267, 110, 130],
    jython=[22, 43, 10, 25, 26, 101, 114, 203, 194, 215, 201, 227, 139, 160],
)

output_file(filename="area.html")

area = Area(
    xyvalues, title="Area Chart",
    xlabel='time', ylabel='memory',
    stacked=True, legend="top_left"
).legend("top_left")

show(area)
Bar

  • values (see Interface inputs): data series to be plotted. Container values must be 1d iterable of scalars.
  • cat (list, optional): list of string representing the categories. Defaults to None.
  • stacked (bool, optional):
    • True: bars are draw as a stack to show the relationship of parts to a whole.
    • False: bars are groupped on the same chart figure. Defaults to False.
  • continuous_range (Range, optional): An explicit range for the continuous axis of the chart (the y-dimension).

In the case where no continuous_range object is passed, it is calculated based on the data provided in values, according to the following rules:

  • with all positive data: start = 0, end = 1.1 * max
  • with all negative data: start = 1.1 * min, end = 0
  • with mixed sign data: start = 1.1 * min, end = 1.1 * max

Example:

from collections import OrderedDict

import pandas as pd

from bokeh.charts import Bar, output_file, show
from bokeh.sampledata.olympics2014 import data

df = pd.io.json.json_normalize(data['data'])

# filter by countries with at least one medal and sort
df = df[df['medals.total'] > 0]
df = df.sort("medals.total", ascending=False)

# get the countries and we group the data by medal type
countries = df.abbr.values.tolist()
gold = df['medals.gold'].astype(float).values
silver = df['medals.silver'].astype(float).values
bronze = df['medals.bronze'].astype(float).values

# build a dict containing the grouped data
medals = OrderedDict(bronze=bronze, silver=silver, gold=gold)

# any of the following commented are also alid Bar inputs
#medals = pd.DataFrame(medals)
#medals = list(medals.values())

output_file("stacked_bar.html")

bar = Bar(medals, countries, title="Stacked bars", stacked=True)

show(bar)

BoxPlot

  • values (see Interface inputs): data series to be plotted. Container values must be 1d iterable of scalars.
  • marker (int or string, optional): the marker type to use if outliers=True (e.g., circle). Defaults to circle.
  • outliers (bool, optional): whether or not to plot outliers. Defaults to True.

Example:

from collections import OrderedDict

import pandas as pd

from bokeh.charts import BoxPlot, output_file, show
from bokeh.sampledata.olympics2014 import data

# create a DataFrame with the sample data
df = pd.io.json.json_normalize(data['data'])

# filter by countries with at least one medal and sort
df = df[df['medals.total'] > 0]
df = df.sort("medals.total", ascending=False)

# get the countries and group the data by medal type
countries = df.abbr.values.tolist()
gold = df['medals.gold'].astype(float).values
silver = df['medals.silver'].astype(float).values
bronze = df['medals.bronze'].astype(float).values

# build a dict containing the grouped data
medals = OrderedDict(bronze=bronze, silver=silver, gold=gold)

# any of the following commented are valid BoxPlot inputs
#medals = pd.DataFrame(medals)
#medals = list(medals.values())
#medals = tuple(medals.values())
#medals = np.array(list(medals.values()))

output_file("boxplot.html")

boxplot = BoxPlot(
    medals, marker='circle', outliers=True, title="boxplot test",
    xlabel="medal type", ylabel="medal count", width=800, height=600)

show(boxplot)

Donut

  • values (see Interface inputs): data series to be plotted. Container values must be 1d iterable of scalars.

Example:

from collections import OrderedDict

import pandas as pd

from bokeh.charts import Donut, show, output_file
from bokeh.sampledata.olympics2014 import data

# throw the data into a pandas data frame
df = pd.io.json.json_normalize(data['data'])

# filter by countries with at least one medal and sort
df = df[df['medals.total'] > 8]
df = df.sort("medals.total", ascending=False)

# get the countries and we group the data by medal type
countries = df.abbr.values.tolist()
gold = df['medals.gold'].astype(float).values
silver = df['medals.silver'].astype(float).values
bronze = df['medals.bronze'].astype(float).values

# build a dict containing the grouped data
medals = OrderedDict()
medals['bronze'] = bronze
medals['silver'] = silver
medals['gold'] = gold

# any of the following commented are also valid Donut inputs
#medals = list(medals.values())
#medals = np.array(list(medals.values()))
#medals = pd.DataFrame(medals)

output_file("donut.html")

donut = Donut(medals, countries)

show(donut)

Dot

  • values (see Interface inputs): data series to be plotted. Container values must be 1d iterable of scalars.
  • cat (list, optional): list of string representing the categories. Defaults to None.

Example:

from collections import OrderedDict

from bokeh.charts import Dot, show, output_file

# create some example data
xyvalues = OrderedDict(
    python=[2, 3, 7, 5, 26],
    pypy=[12, 33, 47, 15, 126],
    jython=[22, 43, 10, 25, 26],
)

# any of the following commented are also valid Dot inputs
#xyvalues = pd.DataFrame(xyvalues)
#xyvalues = list(xyvalues.values())
#xyvalues = np.array(list(xyvalues.values()))

output_file("dots.html")

dots = Dot(
    xyvalues, cat=['lists','loops','dicts', 'gen exp', 'exceptions'],
    title="Dots Example", ylabel='Performance', legend=True
)

show(dots)

HeatMap

  • values (see Interface inputs): data series to be plotted. Container values must be 1d iterable of scalars.
  • cat (list, optional): list of string representing the categories. Defaults to None.

Example:

from bokeh.charts import HeatMap, output_file, show
from bokeh.sampledata.unemployment1948 import data

# pandas magic
df = data[data.columns[:-2]]
df2 = df.set_index(df[df.columns[0]].astype(str))
df2.drop(df.columns[0], axis=1, inplace=True)
df3 = df2.transpose()

output_file("cat_heatmap.html")

hm = HeatMap(df3, title="categorical heatmap", width=800)

show(hm)

Histogram

  • values (see Interface inputs): data series to be plotted. Container values must be 1d iterable of scalars.
  • bins (int): number of bins to use when building the Histogram.
  • mu (float, optional): theoretical mean value for the normal distribution. Defaults to None.
  • sigma (float, optional): theoretical sigma value for the normal distribution. Defaults to None.

Example:

from collections import OrderedDict

import numpy as np
import pandas as pd

from bokeh.charts import Histogram, show, output_file

# build some distributions and load them into a dict
mu, sigma = 0, 0.5
normal = np.random.normal(mu, sigma, 1000)
lognormal = np.random.lognormal(mu, sigma, 1000)
distributions = OrderedDict(normal=normal, lognormal=lognormal)

# create a pandas data frame from the dict
df = pd.DataFrame(distributions)
distributions = df.to_dict()

for k, v in distributions.items():
    distributions[k] = v.values()

# any of the following commented are valid Histogram inputs
#df = list(distributions.values())
#df = tuple(distributions.values())
#df = tuple([tuple(x) for x in distributions.values()])
#df = np.array(list(distributions.values()))
#df = list(distributions.values())[0]

output_file("histograms.html")

hist = Histogram(df, bins=50, legend=True)

show(hist)

Horizon

  • values (see Interface inputs): data series to be plotted. Container values must be 1d iterable of scalars.
  • index (str | 1d iterable of any sort, optional): can be used to specify a common custom index for all data series as follows:
    • As a 1d iterable of any sort that will be used as series common index
    • As a string that corresponds to the key of the mapping to be used as index (and not as data series) if area.values is a mapping (like a dict, an OrderedDict or a pandas DataFrame)
  • num_folds (int, optional): number of folds stacked on top of each other. (default: 3)
  • pos_color (color, optional): The color of the positive folds. Defaults to #006400.
  • neg_color (color, optional): The color of the negative folds. Defaults to #6495ed.

Example:

from collections import OrderedDict

import pandas as pd

from bokeh.charts import Horizon, output_file, show

# read in some stock data from the Yahoo Finance API
AAPL = pd.read_csv(
    "http://ichart.yahoo.com/table.csv?s=AAPL&a=0&b=1&c=2000&d=0&e=1&f=2010",
    parse_dates=['Date'])
MSFT = pd.read_csv(
    "http://ichart.yahoo.com/table.csv?s=MSFT&a=0&b=1&c=2000&d=0&e=1&f=2010",
    parse_dates=['Date'])
IBM = pd.read_csv(
    "http://ichart.yahoo.com/table.csv?s=IBM&a=0&b=1&c=2000&d=0&e=1&f=2010",
    parse_dates=['Date'])

xyvalues = OrderedDict(
    AAPL=AAPL['Adj Close'],
    Date=AAPL['Date'],
    MSFT=MSFT['Adj Close'],
    IBM=IBM['Adj Close'],
)

output_file("horizon.html")

hp = Horizon(
    xyvalues, index='Date',
    title="horizon plot using stock inputs",
    width=800, height=300
)

show(hp)

Line

  • values (see Interface inputs): data series to be plotted. Container values must be 1d iterable of scalars.
  • index (str | 1d iterable of any sort, optional): can be used to specify a common custom index for all chart data series as follows:
    • As a 1d iterable of any sort that will be used as series common index
    • As a string that corresponds to the key of the mapping to be used as index (and not as data series) if area.values is a mapping (like a dict, an OrderedDict or a pandas DataFrame)

Example:

from collections import OrderedDict

from bokeh.charts import Line, show, output_file

xyvalues = OrderedDict(
    python=[2, 3, 7, 5, 26, 221, 44, 233, 254, 265, 266, 267, 120, 111],
    pypy=[12, 33, 47, 15, 126, 121, 144, 233, 254, 225, 226, 267, 110, 130],
    jython=[22, 43, 10, 25, 26, 101, 114, 203, 194, 215, 201, 227, 139, 160],
)

# any of the following commented are also valid Line inputs
#xyvalues = pd.DataFrame(xyvalues)
#xyvalues = xyvalues.values()
#xyvalues = np.array(xyvalues.values())

output_file("lines.html", title="line.py example")

chart = Line(xyvalues, title="Lines", ylabel='measures', legend=True)

show(chart)

Scatter

  • values (see Interface inputs): data series to be plotted. Container values must be 1d iterable of x, y pairs, like i.e.: [(1, 2), (2, 7), ..., (20122, 91)]

Example:

from collections import OrderedDict

from bokeh.charts import Scatter, output_file, show
from bokeh.sampledata.iris import flowers

# fill a data frame with the data of interest and create a groupby object
df = flowers[["petal_length", "petal_width", "species"]]
xyvalues = g = df.groupby("species")

# drop that groupby object into a dict
pdict = OrderedDict()

for i in g.groups.keys():
    labels = g.get_group(i).columns
    xname = labels[0]
    yname = labels[1]
    x = getattr(g.get_group(i), xname)
    y = getattr(g.get_group(i), yname)
    pdict[i] = zip(x, y)

# any of the following commented are also valid Scatter inputs
#xyvalues = pdict
#xyvalues = pd.DataFrame(xyvalues)
#xyvalues = xyvalues.values()
#xyvalues = np.array(xyvalues.values())

output_file("iris_scatter.html")

TOOLS="resize,crosshair,pan,wheel_zoom,box_zoom,reset,previewsave"

scatter = Scatter(xyvalues, tools=TOOLS, ylabel='petal_width')

show(scatter)

Step

  • values (see Interface inputs): data series to be plotted. Container values must be 1d iterable of scalars.
  • index (str | 1d iterable of any sort, optional): can be used to specify a common custom index for all chart data series as follows:
    • As a 1d iterable of any sort that will be used as series common index
    • As a string that corresponds to the key of the mapping to be used as index (and not as data series) if area.values is a mapping (like a dict, an OrderedDict or a pandas DataFrame)

Example:

from collections import OrderedDict

from bokeh.charts import Step, show, output_file

xyvalues = OrderedDict(
    python=[2, 3, 7, 5, 26, 81, 44, 93, 94, 105, 66, 67, 90, 83],
    pypy=[12, 20, 47, 15, 126, 121, 144, 333, 354, 225, 276, 287, 270, 230],
    jython=[22, 43, 70, 75, 76, 101, 114, 123, 194, 215, 201, 227, 139, 160],
)

# any of the following commented are also valid Step inputs
#xyvalues = pd.DataFrame(xyvalues)
#xyvalues = list(xyvalues.values())
#xyvalues = np.array(list(xyvalues.values()))

output_file("steps.html", title="line.py example")

chart = Step(xyvalues, title="Steps", ylabel='measures', legend='top_left')

show(chart)

TimeSeries

  • values (see Interface inputs): data series to be plotted. Container values must be 1d iterable of scalars.
  • index (str | 1d iterable of any sort of datetime values, optional): can be used to specify a common custom index for all chart data series as follows:
    • As a 1d iterable of any sort that will be used as series common index
    • As a string that corresponds to the key of the mapping to be used as index (and not as data series) if area.values is a mapping (like a dict, an OrderedDict or a pandas DataFrame)

Example:

from collections import OrderedDict

import pandas as pd

from bokeh.charts import TimeSeries, show, output_file

# read in some stock data from the Yahoo Finance API
AAPL = pd.read_csv(
    "http://ichart.yahoo.com/table.csv?s=AAPL&a=0&b=1&c=2000&d=0&e=1&f=2010",
    parse_dates=['Date'])
MSFT = pd.read_csv(
    "http://ichart.yahoo.com/table.csv?s=MSFT&a=0&b=1&c=2000&d=0&e=1&f=2010",
    parse_dates=['Date'])
IBM = pd.read_csv(
    "http://ichart.yahoo.com/table.csv?s=IBM&a=0&b=1&c=2000&d=0&e=1&f=2010",
    parse_dates=['Date'])

xyvalues = OrderedDict(
    AAPL=AAPL['Adj Close'],
    Date=AAPL['Date'],
    MSFT=MSFT['Adj Close'],
    IBM=IBM['Adj Close'],
)

# any of the following commented are valid Bar inputs
#xyvalues = pd.DataFrame(xyvalues)
#lindex = xyvalues.pop('Date')
#lxyvalues = list(xyvalues.values())
#lxyvalues = np.array(xyvalues.values())

TOOLS="resize,pan,wheel_zoom,box_zoom,reset,previewsave"

output_file("stocks_timeseries.html")

ts = TimeSeries(
    xyvalues, index='Date', legend=True,
    title="timeseries, pd_input", tools=TOOLS, ylabel='Stock Prices')

# usage with iterable index
#ts = TimeSeries(
#    lxyvalues, index=lindex,
#    title="timeseries, pd_input", ylabel='Stock Prices')

show(ts)

Here you can find a summary table that makes it easier to group and visualize those differences:

Argument Area Bar BoxPlot HeatMap Donut Dot Histogram Horizon Line Scatter Step TimeSeries
values Yes Yes Yes Yes Yes Yes Yes Yes Yes Yes Yes Yes
index Yes No No No No No No Yes Yes No Yes Yes
cat No Yes No Yes No Yes No No No No No No
stacked Yes Yes No No No No No No No No No No
pallette No No No Yes No No No No No No No No
bins No No No No No No Yes No No No No No
mu No No No No No No Yes No No No No
sigma No No No No No No Yes No No No No No
num_folds No No No No No No No Yes No No No No
pos_color No No No No No No No Yes No No No No
ned_color No No No No No No No Yes No No No No

Note

Scatter values are supposed to be iterables of coupled values. I.e.: [[(1, 20), ..., (200, 21)], ..., [(1, 12),... (200, 19)]]

Interface outputs

As with the low and middle level Bokeh plotting APIs, in bokeh.charts, we also support the chart output to:

  • a file:

    hist = Histogram(distributions, bins=50, filename="hist.html")
    hist.show()
    
    # or use
    from bokeh.plotting import output_file, show
    output_file('hist.html')
    show(hist)
    
  • to bokeh-server:

    hist = Histogram(distributions, bins=50, server=True)
    hist.show()
    
    # or use
    from bokeh.plotting import output_server, show
    output_server('hist')
    show(hist)
    
  • to IPython notebook:

    hist = Histogram(distributions, bins=50, notebook=True)
    hist.show()
    
    # or use
    from bokeh.plotting import output_notebook, show
    output_notebook()
    show(hist)
    

Note

You can output to any or all of these 3 possibilities because, right now, they are not mutually exclusive.

Chart Builders

Since 0.8 release Charts creation is streamlined by specific objects called Builders. Builders are convenience classes that create all computation, validation and low-level geometries needed to render a High Level Chart. This provides clear pattern to easily extend the Charts interface with new charts. For more info about this refer to Builders reference.